

- SUNTORY BEVERAGE & FOOD
- > News Release
- > Suntory Water Report
No.SBF0174( 15, 2014 )
Suntory Beverage & Food Limited
R&D
Suntory Water Report
Increased popularity of sparkling water and flavored water
expands consumer views on drinking water
I. Japanese mineral water market (P2 – P4)
Since launching on the commercial market in the early 1970s, increasing demand for "clean, delicious water" and interest in the beauty and health benefits of water has propelled the mineral water market to continuous growth to a point where it is now a part of peoples’ everyday lives. Following the Great East Japan Earthquake, the Japanese market saw further growth in 2013 and today is the largest it has ever been.
II. Consumer trends survey (P5 – P16)
This is the 2014 edition of the consumer drinking water trends survey that Suntory has conducted since 1991. The following is a report on the current state and future outlook on consumer trends for mineral water as well as sparkling water and flavored water, which have seen surges in popularity in recent years.
I. Japanese mineral water market
The history of mineral water in Japan dates back to the early 1970s when bottled mineral water was first sold on the commercial market. While reflecting the various elements of the times, mineral water has gradually permeated into the Japanese lifestyle over the years.
● Late 1980s: Growth of the general consumer market
Increased familiarity of mineral water driven by the natural and healthy living trends as well as increase overseas travel by Japanese people and growing concerns related to the quality of tap water caused a transition in growth from the commercial to the general consumer market.
● 1990s: Major growth in general consumer market
Entering the 1990s, news media began to report on the cleanliness of apartment building water tanks and issues with tap water. These reports sparked an increase in the consumption of mineral water among general consumers. Domestic mineral water grew as an alternative to tap water and a boom in 1993 also saw import volume grow.
An extremely hot summer and water shortage in 1994 resulted in increased demand and increased awareness about the need for emergency reserves. These factors helped establish mineral water’s position as a household product.
However, imported mineral water decreased dramatically following a contamination scandal in autumn 1995 and in 1996 the consumer mineral water market sales underperformed previous year sales for the first time in the 1990s. However, this incident created a higher level of consumer awareness regarding mineral water safety as quality reliability became the key impetus for consumer purchases.
In April 1996, Japan allowed the sale of domestically produced small-volume PET bottle products. This increased occasions for mineral water consumption and resulted in a significant increase in volumes of domestic mineral water.
The so-called "Y2K Problem" caused many people to stock mineral water in their homes out of concerns about power outages and mineral water sales in 1999 increased by 30% compared to the previous year.
● 2000s: Market growth with increase in health consciousness, market achieves record growth in 2013
From the year 2000 through 2006, increased health consciousness fueled market expansion. However, beginning in 2007 an increased trend in consumer conservatism and sales remained on par with previous years. In 2011, the sudden demand for reserves seen following the Great East Japan Earthquake with sales jumping from 3,172,000 kiloliters (year on year increase from 126.0%). This was represented an 11-fold increase over twenty years ago and a 2.5-fold increase compared to 10 years ago. (Figure 1: according to Mineral Water Association of Japan research)
In 2012, although domestic mineral water product increased, imported mineral water volume decreased significantly. However, in 2013 domestic mineral water (2,865,000 kiloliters: YoY 102.8%) and imported mineral water (390,000 kiloliters: YoY 110.4%) both outperformed the previous year for a record total market scale of 3,255,000 kiloliters.
![[Figure 1] Trends in Japanese mineral water market](http://www.suntory.co.jp/softdrink/news/img/sbf0714e-01.jpg)
● 2000s: Japanese domestic per capita annual consumption trends
From 2007, Japanese domestic per capital annual mineral water consumption held steady at around 19.7 liters. However, in 2011, due in part to the impact of the Great East Japan Earthquake, this grew significantly to 24.8 liters and reached record levels in 2013 at 25.6 liters. (Figure 2: according to Mineral Water Association of Japan research)
![[Figure 2] Japanese domestic per capita annual consumption trends (unit: liters)](http://www.suntory.co.jp/softdrink/news/img/sbf0714e-02.jpg)
II. Survey of 500 consumers age 20 – 69
| State of mineral water and other "drinking water" consumption |
Survey overview
Today, mineral water has become a vital part of our daily lives. Suntory Beverage & Food Limited (SBF) has conducted market trend surveys annually since 1991 for the purpose of analyzing how mineral water is consumed as well as consumption frequency, motivation, and preferences. Since 2003, we expanded our survey scope beyond "consumers who drink mineral water at home" to examine general consumer attitudes towards not just mineral water but the overall "drinking water" market. And beginning in 2010, we changed survey methods from direct questionnaires to internet-based surveys.
Drinking water market trend survey
1. Survey target
Targeted individual men and women age 20 – 69 living in the Metropolitan region (Tokyo, and Kanagawa, Chiba, Saitama prefectures) and Kansai region (Osaka, Kyoto, Hyogo, and Nara prefectures) who have purchased one of the following six types of waters or who used tap water as "drinking water" since May of last year.
a) Mineral water (non-carbonated, non-sweetened water sold in PET bottles, cans, or bottles)
b) Carbonated water or sparkling water
c) Flavored water
d) Mineral water home delivery services (in-home water server)
e) Supermarket and other self-service water filling stations
f) In-home water purification (alkaline ion water filters or purifiers connected directly to tap water pipes)
2. Survey size
500 people (253 men, 247 women)
3. Survey method
Internet questionnaire
4. Survey period
May 30 – June 2, 2014
An overview of survey results is as follows.
Survey results
(1) "Drinking water" consumption rates over the past one year
| Rate of "mineral water" consumption was highest at 88.0%. Rate of "sparkling water" consumption was more than half and "flavored water" consumption also exceeded 40%, indicating broad permeation within everyday lifestyles. |
Regarding the six types of drinking water - mineral water (non-carbonated, non-sweetened water sold in PET bottles, cans, or bottles), carbonated water or sparkling water, flavored water, mineral water home delivery services, supermarket and other self-service water filling stations, and in-home water purification – we researched consumption rates (rate of consumption/use) for the past one year. Results showed that "mineral water" had the highest rate of use at 88.0%. Also, at 54.6% more than half of respondents consumed "carbonated water or sparkling water" while over 40% of respondents (41.8%) consumed "flavored water" (Figure 3).
![[Figure 3]](http://www.suntory.co.jp/softdrink/news/img/sbf0714e-03.jpg)
(2) Concerns when drinking/using mineral water
| Concerns when drinking/using mineral water include price, taste, and safety. Compared to last year, percentage of people concerned about taste increased by 8 points. |
Next, we asked about consumer concerns when drinking/using mineral water. The largest number of people were concerned about price (63.4%) while taste (47.9%), safety (41.5%), and quality (39.6%) were also among top concerns.
Compared to results from 2013, the percentage of people concerned about quality increased by 3 points and taste by nearly 8 points. This indicates that while safety and quality are obvious concerns, there is a growing trend of importance being placed on the actual taste (flavor) of the mineral water (Figure 4).
![[Figure 4] Concerns when drinking/using mineral water (top 8 responses)(multiple responses)](http://www.suntory.co.jp/softdrink/news/img/sbf0714e-04.jpg)
(3) Places thought of as sources for "mineral water"
| Place thought of as source for "mineral water" is the Minami-Alps. |
We asked mineral water consumers the place that comes to mind when they imagine location from which mineral water is sourced. Again, the "Minami-Alps" (Yamanashi Prefecture) was No. 1 in 2014. This year as well, over 90% of consumers envision the "Minami-Alps" as the location from which mineral water is drawn (Figure 5).
![[Figure 5] Places thought of as source for](http://www.suntory.co.jp/softdrink/news/img/sbf0714e-05.jpg)
(4) Reasons for using mineral water home delivery services (water servers)
| Convenience topped reasons for using mineral water home delivery services |
We surveyed users of mineral water home delivery services regarding the reasons for using these services.
The top two reasons were "because they deliver to my home" and "the water server (with both hot and cold water) is convenient." Both reasons are related to the convenience provided by the delivery service and the water server and even compared to last year we see a growing trend in the number of consumers opting for convenience. Other reasons included "taste" and "peace of mind" (Figure 6).
![[Figure 6] Reasons for using mineral water home delivery services (multiple responses)](http://www.suntory.co.jp/softdrink/news/img/sbf0714e-06.jpg)
(5) Use of mineral water provided by home delivery services (water servers)
| Mineral water provided by home delivery services is being used in all aspects of daily life, including for making tea, cooking, and hot drinking water. |
We also asked consumers about how they use mineral water home delivery services. In addition to "drinking it as is," other uses included "for making teas and coffee," "for taking medicine," and water for making "miso soup." This indicates that mineral water home delivery services are being utilized in every aspect of everyday life (Figure 7).
![[Figure 7] Uses of mineral water provided by home delivery services (water servers) in 2014 (multiple responses)](http://www.suntory.co.jp/softdrink/news/img/sbf0714e-07.jpg)
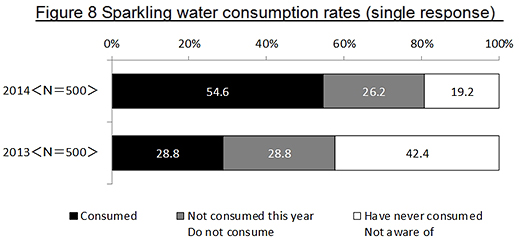
(6) Sparkling water rate of consumption and usage
| The rate of consumption for sparkling water was 54.6%, nearly double the rate of the previous year. In addition to alcoholic beverages, original uses including mixing with juices and vinegars are becoming more popular. |
Over the past year, over half of consumers (54.6%) used or consumed sparkling water.
Compared to 2013, consumption nearly doubled from 28.8% to 54.6% while non-consumption/not aware declined significantly from 42.4% to 19.2% (Figure 8).
We surveyed consumers about how they consume sparkling water. The top response was "drinking as is" at 83.1% while "mixing" with alcohol or non-alcohol beverages was more than half at 52.6% (Figure 9).
![[Figure 9] Sparkling water consumption methods (multiple responses)](http://www.suntory.co.jp/softdrink/news/img/sbf0714e-09.jpg)
We also asked consumers who responded that they mixed the sparkling water (112 people) what they mixed the sparkling water with. The top response was "mixing with alcohol" at 54.5% while other responses included "mixing with juice or non-alcoholic beverages" (41.1%) and "mixing with dark vinegar and fruit vinegar" (21.4%). This indicates that consumers are enjoying sparkling water in a number of ways.
Instead of drinking sparking water "straight" as is, there is a growing trend of original drinks using sparkling water, which is helping to broaden the sparkling water market (Figure 10).
![[Figure 10] Beverages being mixed with sparkling water (multiple responses)](http://www.suntory.co.jp/softdrink/news/img/sbf0714e-10.jpg)
(7) Concerns when choosing sparkling water
| Top concerns among consumers of sparkling water included "strength of carbonation," "price," "flavor," and "taste of the actual water." |
We surveyed people who had consumed sparkling water over the past year about how they chose sparkling water. The top response was "strength of carbonation" (44.6%) while other responses included "cheap price" (35.2%), "flavor" (33.3%), "taste of the actual water" (31.5%), and "use of mineral water" (30.5%).
This indicates that consumers are concerned not only about the refreshing stimulation provided by the strength of carbonation, but also the based quality of the water in terms of the flavor, taste of the actual water, and the use of mineral water (Figure 11).
![[Figure 11] Concerns when choosing sparkling water (multiple responses)](http://www.suntory.co.jp/softdrink/news/img/sbf0714e-11.jpg)
(8) Flavored water consumption rates and reasons for consumption
| Flavor water consumption is highest among younger generations with more than half of consumers in their 20s (57.3%) choosing flavored water. |
Over the past year, the number of people who consumed flavored water was 41.8%. Broken down by age group, it becomes clear that consumption increases among younger age groups with more than half of consumers in their 20s (57.3%) choosing flavored water (Figure 12).
![[Figure 12] Flavored water consumption (total/by age) single response)](http://www.suntory.co.jp/softdrink/news/img/sbf0714e-12.jpg)
We also asked consumers about why they chose flavored water. The top response was "because it tastes good" (44.0%). Other responses included "because it is refreshing" (40.7%), "because I want something with a little flavor" (34.4%), and "because it is easy to drink" (33.0%). This indicates that consumers are choosing flavored water because of the taste (Figure 13).
![[Figure 13] Reasons for consuming flavored water (multiple responses)](http://www.suntory.co.jp/softdrink/news/img/sbf0714e-13.jpg)
(9) Concerns when choosing flavored water
| Consumer concerns related to flavored water include not only the "taste of the flavor" but also the quality of the actual water. |
We surveyed consumers about how they chose flavored water. The top response was "taste of the flavor" (68.9%) while other top responses included "taste/flavor of the actual water" (31.1%), "price" (26.8%), and "use of mineral water" (24.9%).
With the growth in the variety of sparkling water and flavored water between 2013 and 2014, we are seeing an increase in the number of drinkers of not only mineral water, but also sparkling and flavored water.
In what types of situations are these waters being consumed? ![[Figure 14] Concerns when choosing flavored water (multiple responses)](http://www.suntory.co.jp/softdrink/news/img/sbf0714e-14.jpg)
(10) How drinking water is consumed in daily life
How drinking water is consumed in daily life is evolving
Mineral water has become a daily norm, sparkling water is for relaxing, and flavored water are consumed based on desire
![[Figure 15] Top 5 consumption types for each drinking water type (multiple responses)](http://www.suntory.co.jp/softdrink/news/img/sbf0714e-15.jpg)