Suntory Group has brought together its performance for the main indicators (management, environment, and society) on our sustainability site and other media.
Boundary
259 Group companies in Japan and overseas, including Suntory Holdings Ltd.
- The boundary of environmental data is as follows except where otherwise stated individually.
2023: data covers 27 production plants in Japan and 62 production plants overseas.
2024 and 2025: data covers 27 production plants in Japan and 52 production plants overseas. - The boundary of HR data, describe the scope of data individually.
Independent Assurance
Actual results marked with ★ have received independent assurance (hereafter Limited Assurance) from Deloitte Tohmatsu Sustainability Co., Ltd. in accordance with International Standard on Assurance Engagements (ISAE) 3000 and ISAE 3410.
Key Financial Data
Consolidated financial Results
-
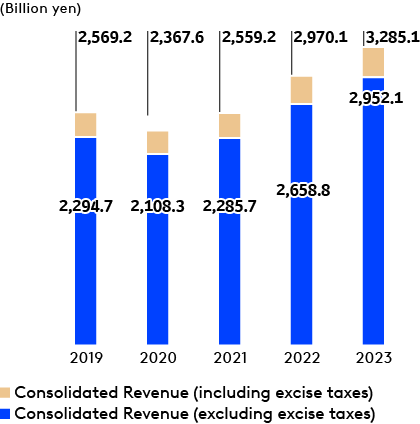
Consolidated Revenue
-
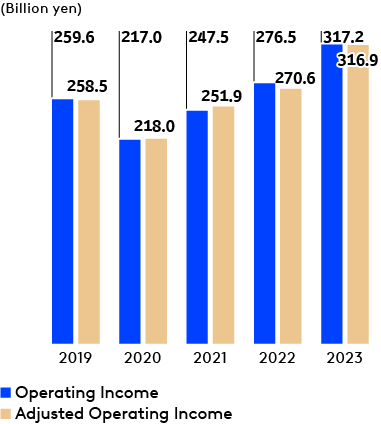
Consolidated Operating Income
-
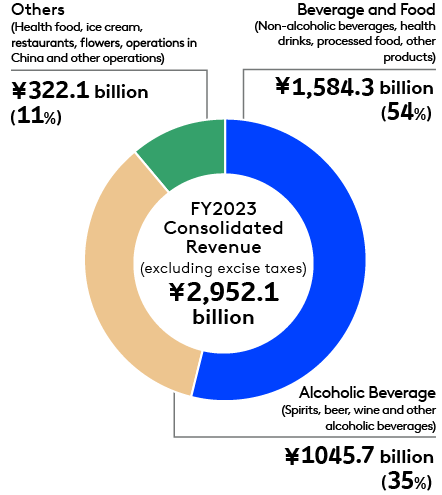
Sales by Business Segment
-
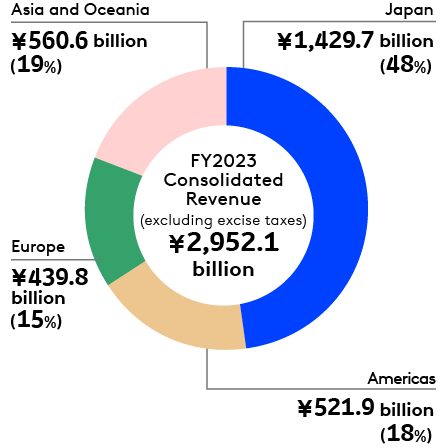
Sales by Area
Environmental Data
Targets and Progress<Water>
| 2030 | 2025 Results |
|---|---|
| Reduction of water used in direct operation Reduce the water intensity of production at our owned plants by 35%*1 globally. In addition, explore reduction of absolute amount of water withdrawn in highly water stressed areas |
Reduced the water intensity of production by 31% compared to 2015. |
| Water replenishment Replenish more than 100% of water used in at least 50% of our owned plants*2 globally, including all those in highly water stressed areas, through local water source conservation efforts. Especially in regions with high water stress, the above initiatives are implemented at all factories. |
|
| Sustainable water use in raw ingredients Collaborate with suppliers to improve water-use efficiency in the production of water-intensive key ingredients*3 in highly water stressed areas. |
|
| Water education and access to safe water Expand water education programs and initiatives to provide safe water access for more than 5 million people. |
Total 2,610,000 people Water education program: 2,100,000 people Provision of safe water: 500,000 people |
-
*1Reduction of water intensity of production based on 2015 baseline year
-
*2Suntory Group plants that manufacture finished products: 27 plants in Japan, 52 plants overseas
-
*3Coffee, barley, grapes
Water Stewardship
| Community Engagement | Unit | 2015 (base year) | 2023 | 2024 | 2025 |
|---|---|---|---|---|---|
| Total water withdrawal | thousand m3 | - | 38,775 | 37,173 | 35,672★ |
| Water intensity | m3/kL | 4.53 | 3.26 | 3.17 | 3.15 |
| Total water discharge | thousand m3 | - | 24,496 | 22,898 | 21,888★ |
| Total water consumption | thousand m3 | - | 14,279 | 14,275 | 13,784 |
Water Withdrawal from Areas
| Area | Water withdrawal (thousand m3) | ||
|---|---|---|---|
| 2023 | 2024 | 2025 | |
| Japan | 21,713 | 21,707 | 21,408 |
| Americas | 4,361 | 4,092 | 3,810 |
| Europe | 5,810 | 5,154 | 4,468 |
| Asia | 6,469 | 5,790 | 5,304 |
| Oceania | 422 | 429 | 682 |
| Africa | - | - | - |
| Total | 38,775 | 37,173 | 35,672★ |
Amount of Water withdrawal by Source
| Intake source | Water withdrawal (thousand m3) | |||
|---|---|---|---|---|
| 2023 | 2024 | 2025 | ||
| Groundwater | 17,530 | 16,606 | 16,456★ | |
| Rivers/lakes | 3,382 | 2,539 | 1,799★ | |
| Rain water | 2 | 5 | 3★ | |
| City water | 17,861 | 18,023 | 17,414★ | |
| Total | 38,775 | 37,173 | 35,672★ | |
Water Discharge to each destination
| Destination | Water withdrawal (thousand m3) | |||
|---|---|---|---|---|
| 2023 | 2024 | 2025 | ||
| Rivers/lakes | 14,874 | 13,565 | 13,103★ | |
| Sea | 1,471 | 1,354 | 1,094★ | |
| Sewers | 7,989 | 7,884 | 7,620★ | |
| Others (for watering plants, etc.) | 162 | 95 | 71★ | |
| Total | 24,496 | 22,898 | 21,888★ | |
Water Pollution Emissions
| Emissions (t) | Calculation Method (2025) | |||
|---|---|---|---|---|
| 2023 | 2024 | 2025*1 | ||
| Biochemical Oxygen Demand (BOD) | 27 | 24 | 23★ | Calculated by multiplying the annual average BOD concentration in wastewater at sites that discharge into rivers by the annual volume of wastewater discharged. |
| Chemical Oxygen Demand (COD) | 7 | 7 | 2★ | Calculated by multiplying the annual average COD concentration in wastewater discharged into marine areas or lakes by the annual volume of wastewater discharged. |
- *1
Data covers 21 production plants in Japan that meet the following calculation criteria
- when discharged into sewage systems, neither BOD nor COD is recorded
- BOD is recorded for discharge into rivers, and COD for discharge into marine areas or lakes.
Number of Participants in the Suntory Mizuiku and Other Water Education Program
| Area | 2023 | 2024 | 2025 |
|---|---|---|---|
| Japan | 76,217 | 90,779 | 113,810 |
| Vietnam | 57,850 | 534,228 | 531,449 |
| Thailand | 5,905 | 5,220 | 11,505 |
| France | 780 | 751 | 765 |
| China | 26,743 | 30,206 | 32,515 |
| Spain | 1,276 | 2,614 | 6,930 |
| United Kingdom | 665 | 803 | 1,113 |
| New Zealand | 5,574 | 0 | 3,300 |
| Americas | 4,667 | 10,695 | 9,238 |
| Indonesia (figures only available until 2023) | 21,500 | - | - |
| Australia | - | - | 3,957 |
Targets and Progress <GHG>
| 2030 | 2025 Results |
|---|---|
| Reduce GHG emissions from our direct operations (Scope 1 and 2) by 50%*1 | 36% reduction compared to 2019 |
| Reduce GHG emissions across our entire value chain by 30%*1 | 17% reduction compared to 2019 |
-
*1Based on emissions in 2019.
Scope 1 and 2 Emissions
| Area | Scope | GHG emissions (Scope 1: thousand tons CO2e, Scope 2: thousand tons CO2) | |||
|---|---|---|---|---|---|
| 2019 (base year) |
2023 | 2024 | 2025*1,2,3,4 | ||
| Japan | Scope 1 | 250 | 215 | 218 | 213 |
| Scope 2 | 183 | 37 | 24 | 32 | |
| Scope 1+2 | 433 | 253 | 242 | 246 | |
| Americas | Scope 1 | 162 | 194 | 165 | 165 |
| Scope 2 | 63 | 0 | 0 | 0 | |
| Scope 1+2 | 225 | 194 | 165 | 165 | |
| Europe | Scope 1 | 108 | 100 | 94 | 84 |
| Scope 2 | 17 | 0 | 0 | 0 | |
| Scope 1+2 | 125 | 100 | 95 | 84 | |
| Asia | Scope 1 | 51 | 47 | 38 | 39 |
| Scope 2 | 153 | 170 | 138 | 109 | |
| Scope 1+2 | 204 | 217 | 176 | 147 | |
| Oceania | Scope 1 | 11 | 8 | 7 | 6 |
| Scope 2 | 7 | 1 | 2 | 1 | |
| Scope 1+2 | 19 | 9 | 9 | 7 | |
| Africa | Scope 1 | 7 | - | - | - |
| Scope 2 | 1 | - | - | - | |
| Scope 1+2 | 8 | - | - | - | |
| Total | Scope 1 | 590 | 564 | 522 | 506 |
| Of which, independently assured | - | 515 | 481 | 455★ | |
| Scope 2 | 424 | 208 | 164 | 141 | |
| Of which, independently assured | - | 206 | 162 | 139★ | |
| Scope 1+2 | 1,014 | 772 | 687 | 648 | |
| Of which, independently assured | - | 721 | 643 | 594★ | |
-
*1The calculation policy for Scope 1 and 2 emissions is as follows:
Scope 1: Covers direct emissions from the Group’s own operations; calculated mainly by multiplying fuel consumption by emission factors.
Scope 2: Covers indirect emissions associated with the purchase and use of electricity, steam, heat, or cooling; calculated mainly by multiplying energy consumption by applicable emission factors. -
*2Emission factors for GHG calculations are as follows:
Fuel:
For Japan: Factors specified by the Act on the Rational Use of Energy and the Act on Promotion of Global Warming Countermeasures.
For overseas: Factors obtained from fuel suppliers, or factors specified by the Act on the Rational Use of Energy and the Act on Promotion of Global Warming Countermeasures.
GHG from purchased energy:
For Japan: The adjusted emission factors for each energy company specified by the Act on Promotion of Global Warming Countermeasures, for submission in 2025.
For overseas: In principle, emission factors obtained from energy suppliers; where these cannot be obtained, International Energy Agency (IEA) emission factors by country.
GHG other than CO2:
For Japan: Factors specified by the Act on Promotion of Global Warming Countermeasures.
For overseas: Actual measurements or derived values are used in accordance with local laws and regulations in each country, however, certain figures are estimated using a basic unit calculated from the production volume and emissions of certain plants in Japan.
The total may not match the sum of the figures due to rounding.
GHG emissions quantification is subject to uncertainty when measuring activity data, determining emission factors, and considering scientific uncertainties inherent in the global warming potentials. -
*3GHG emissions are aggregated using the entire Suntory Group as the reporting boundary.
-
*4The sites subject to independent assurance are as follows:
- 27 production plants in Japan, 52 production plants overseas related to the beverage and food business, alcoholic beverages business, and health food business, and
- non-production sites in Japan.
Scope 3 Emissions (Results for 2025) *1,2
| Category | Emissions (thousand tons CO2e) |
Calculation Method |
|---|---|---|
|
4,674★ |
[Raw materials and packaging] Calculated by multiplying the purchased and used weight of the raw materials and packaging materials for products manufactured and sold by the Suntory Group by emission factors. In descending order of data specificity, the emission factors referenced range from: supplier-specific emission factors obtained from suppliers to emission factors calculated by combining primary supplier data with Life Cycle Assessment (LCA) databases (in accordance with the hybrid method described in the GHG Protocol Scope 3 Calculation Technical Guidance). These are followed by emission factors published by public agencies in the respective regions and finally emission factors sourced from domestic and overseas LCA databases. [Contract manufacturers] Calculated by multiplying the production volume of products that domestic and overseas Suntory Group companies have outsourced for manufacturing by emission factors. |
|
516★ | Emissions related to the Suntory Group’s capital expenditure are calculated by multiplying the amount of capital expenditure, excluding land and related assets, by emission factors from the Ministry of the Environment’s database. For barrels, however, emissions are calculated by multiplying the number of purchased barrels by emission factors combining ecoinvent and industry-association statistics. *3 |
|
130 | Calculated by multiplying the Suntory Group’s energy consumption by emission factors based on secondary data such as AIST-IDEA and the Ministry of the Environment database relating to the extraction, collection, production, and transportation of the relevant energy resources. |
|
458 | [Transportation] Calculated by multiplying the Suntory Group’s transportation volume (ton-km) by emission factors combining carriers’ actual data with secondary data such as the Ministry of the Environment database. [Warehousing] Calculated by multiplying the storage volume and as well as floor area at distribution centers owned by other companies and used by the Suntory Group by emission factors based on warehousing operators’ actual data. *4 |
|
14 | Calculated by multiplying the weight of waste generated by the Suntory Group by emission factors based on secondary data such as the Ministry of the Environment database. |
|
26 | Calculated by multiplying the Suntory Group’s business travel expenses by emission factors from the Comprehensive Environmental Data Archive (CEDA) database. |
|
23 | Calculated by multiplying the Suntory Group’s commuting expenses by emission factors from the CEDA database. |
|
- | Not applicable*4 |
|
584 | [Transportation] Calculated by multiplying the Suntory Group’s transportation volume (ton-km) by AIST-IDEA transportation emission factors. [Points of sale] Emissions from electricity and refrigerants at stores and other outlets that sell products are calculated by multiplying sales volume by emission factors from a report published by the Aluminum Association.*5 |
|
- | Records the emissions of contract manufacturers when the Suntory Group sells raw materials to them for processing into products. However, there are currently no applicable cases. |
|
58 | Calculated by multiplying the atmospheric release of carbon dioxide gas when the Suntory Group’s products are opened by an emission factor, based on the actual carbon dioxide gas usage at manufacturing sites.*5 |
|
274★ | Calculated by multiplying the purchased and used weight of packaging materials by the Suntory Group by emission factors combining secondary data such as AIST-IDEA and the Ministry of the Environment database relating to disposal and recycling processing. |
|
443★ | Calculated by multiplying the electricity consumption of the Suntory Group’s leased equipment by emission factors based on secondary data such as the Ministry of the Environment database. |
|
29 | Calculated for the emissions of franchised companies and stores managed by the Suntory Group, using proportional calculations based on actual data of the Group’s own facilities and directly operated stores. |
|
- | Excluded from the scope of calculation due to the nature of the business. |
| Total | 7,227 |
-
*1The total may not match the sum of the figures due to rounding. GHG emissions quantification is subject to uncertainty when measuring activity data, determining emission factors, and considering scientific uncertainty inherent in the global warming potentials.
-
*2Except for Category 2, the boundary is the Suntory Group’s beverage and food business, alcoholic beverages business, and health food business in Japan and overseas. For some overseas group companies, emissions were estimated using Japan-based emission factors or production volumes.
-
*3Covers the entire Suntory Group.
-
*4The emissions of distribution centers owned by other companies, which were previously recorded under Category 8, have been reinterpreted as part of upstream transportation and distribution and reclassified to Category 4.
-
*5The emissions at product points of sale, which were previously recorded under Category 11, have been reinterpreted as part of downstream transportation and distribution and reclassified to Category 9.
Energy Consumption*1
| 2023 | 2024 | 2025*2,3 | |
|---|---|---|---|
| Energy Consumption (MWh) | 4,122,342 | 3,975,287 | 3,838,857 |
| Electricity Consumption (MWh) | 1,194,505 | 1,130,365 | 1,108,760 |
| Of which, independently assured | 1,188,671 | 1,124,060 | 1,100,191★ |
| Of which, renewable energy consumption (MWh) | 950,977 | 990,786 | 1,012,198 |
| Of which, independently assured | 949,169 | 988,515 | 1,007,225★ |
| Energy Intensity (MWh/kL) | 0.35 | 0.34 | 0.34 |
-
*1Energy consumption is aggregated using the entire Suntory Group as the reporting boundary.
-
*2Electricity consumption includes in-house generation.
-
*3Renewable energy consumption and electricity consumption have been independently assured for results excluding non-production sites outside Japan. The sites covered are as follows: 27 production plants in Japan, 52 production plants overseas related to the beverage and food business, alcoholic beverages business, and health food business, and non-production sites in Japan.
SOx emissions
| 2023 | 2024 | 2025 | |
|---|---|---|---|
| Emissions (t) | 2.4 | 2.3 | 2.1 |
| Per Unit (g/kL) | 0.5 | 0.4 | 0.4 |
-
*Data covers 27 production plants in Japan
NOx emissions
| 2023 | 2024 | 2025 | |
|---|---|---|---|
| Emissions (t) | 114.0 | 90.9 | 77.4 |
| Per Unit (g/kL) | 21.8 | 17.5 | 15.4 |
-
*Data covers 27 production plants in Japan
By-products and Waste Generation Performance
| Area | Amount of discharge (thousand ton) | ||
|---|---|---|---|
| 2023 | 2024 | 2025 | |
| Japan | 271 | 251 | 222 |
| Americas | 427 | 301 | 476 |
| Europe | 166 | 139 | 92 |
| Asia | 32 | 32 | 23 |
| Oceania | 3 | 2 | 4 |
| Africa | - | - | - |
| Total | 900 | 724 | 817 |
Recycling Rate of Japanese Plants and Flow for Reuse of By-products and Waste Generated in Each Production Process
| 2023 | 2024 | 2025 | |
|---|---|---|---|
| Amount of discharge (thousand ton) | 271 | 251 | 222 |
| Amount recycled (thousand ton) | 271 | 245 | 222 |
| Recycling rate (%) | 99.9 | 97.8 | 100.0 |
-
*Data covers 27 production plants in Japan
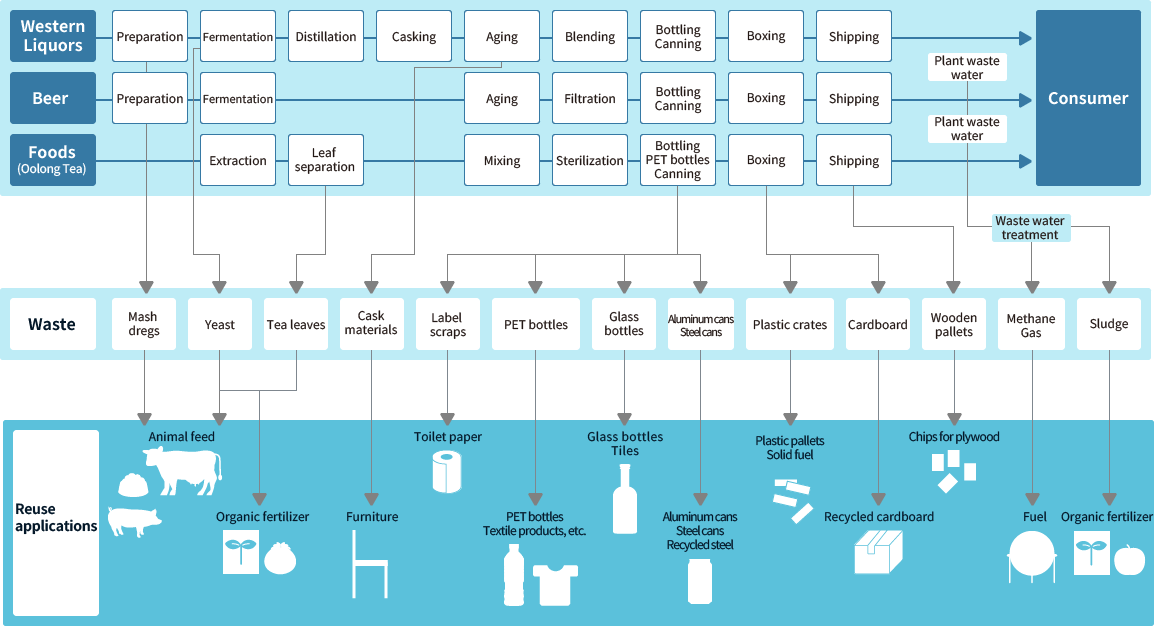
By-products and Waste Generation, Recycling Rate and the Purpose of Use for Recycled Products
| Type of waste | Main Purpose of Use | 2023 | 2024 | 2025 | |||
|---|---|---|---|---|---|---|---|
| Generation (t) |
Recycling Rate (%) | Generation (t) |
Recycling Rate (%) | Generation (t) |
Recycling Rate (%) | ||
| Vegetable (glycation, tea, coffee dregs, etc.) | - Animal feed - Fertilizer |
203,440 | 100 | 158,404 | 100 | 158,412 | 100 |
| Sludge (excess sludge, etc.) | - Fertilizer | 30,444 | 100 | 28,472 | 100 | 29,752 | 100 |
| Wood waste (cask, palletes) | - Furniture materials - Plywood raw materials |
4,243 | 98 | 3,993 | 98 | 3,218 | 98 |
| Glass and ceramic scrap | - Glass materials - Base course material |
1,224 | 100 | 1,281 | 100 | 1,173 | 100 |
| Paper scraps (cardboards, paper labels, etc.) | - Recycled paper - Cardboard materials |
5,671 | 100 | 5,660 | 100 | 5,271 | 100 |
| Plastic | - Palette - Solid fuel - Supplementary fuel |
6,036 | 100 | 5,838 | 100 | 5,889 | 100 |
| Metal scraps (aluminum, steel) | - Aluminum - Steel ingredients |
3,033 | 100 | 2,693 | 100 | 2,475 | 100 |
| Other | 16,863 | 100 | 44,196 | 87 | 15,741 | 100 | |
| Total | 270,953 | 100 | 250,537 | 98 | 221,930 | 100 | |
-
*Data covers 27 production plants in Japan
Environmental Training
| Target | Number of participating employees | |
|---|---|---|
| Onboarding training (environmental management class) | New employees | 266 |
| ISO14001 awareness and special education | Plant employees | 53 |
| Sustainability management training (e-learning, etc.) | Group employees in Japan | Employees from relevant departments |
| Internal ISO14001 auditor training | Internal ISO14001 auditor | 61 |
| Environmental Law Training | Employees from relevant departments | 108 |
| Wastes Disposal and Public Cleansing Act seminar | Employees from relevant departments | 366 |
Social Data
Employee Composition
| Employee Composition | 2023 | 2024 | 2025 | Scope | ||
|---|---|---|---|---|---|---|
| Number of Suntory Group employees (people) | 41,511 | 41,357 | 41,628 | All Suntory Group companies | ||
| Suntory Group companies within Japan (people) | 19,330 | 19,820 | 20,053 | |||
| Suntory Group companies outside Japan (people) | 22,181 | 21,537 | 21,575 | |||
| Of which, employees of Suntory Holdings and Suntory Beverage & Food (people) (Below, shown as SHD/SBF) |
7,723 | 7,827 | 9,397 | Suntory Holdings Limited and Suntory Beverage & Food Japan | ||
| Regular employees (people) | 7,411 | 7,526 | 9,095 | |||
| (Average age) (year ) | 43 | 43 | 42 | |||
| Executives (people) | 66 | 70 | 67 | |||
| Advisors (people) | 25 | 25 | 36 | |||
| Non-regular employees (contract employees, etc.) (people) | 184 | 170 | 155 | |||
| Other (athletes, etc.) (people) | 37 | 36 | 44 | |||
Employee Retention
| Employee Retention | 2023 | 2024 | 2025 | Scope | ||
|---|---|---|---|---|---|---|
| Number of new hires (people) | 287 | 338 | 411 | Full-time employees of Suntory Holdings Limited and Suntory Beverage & Food Japan | ||
| Number of recent graduates hired (people) | 170 | 232 | 276 | |||
| Number of mid-career hires (people) | 117 | 106 | 135 | |||
| Number of employees leaving the company (people) | 224 | 240 | 174 | |||
| Mandatory retirement (people) | 143 | 141 | 88 | |||
| Of which, early retirement (people) | 51 | 68 | 60 | |||
| Voluntary retirement (people) | 68 | 88 | 79 | |||
| Others (people) | 13 | 11 | 7 | |||
| Employee turnover rate (voluntary + early retirement) (%) | 1.7 | 2.1 | 1.9 | |||
| Percentage of new graduate hires who are still with the company after 5 years *1(%) | 88.2 | 91.8 | 88.8 | |||
| Average number of years of service (years) | 17.7 | 17.6 | 16.3 | |||
-
*1Calculated for new graduate hires (Full-time employees) of Suntory Holdings and Suntory Beverage & Food from 2018 to 2020.
Career Development
| Career Development | 2023 | 2024 | 2025 | Scope | |
|---|---|---|---|---|---|
| Number of employees submitting applications through the career development internal recruitment system*1 (entry) | 226 | 193 | 183 | Full-time employees of Suntory Holdings Limited and Suntory Beverage & Food Japan | |
| Number of employees whose applications were approved (people) | 31 | 27 | 24 | ||
| Career Vision interview*2 implementation rate (%) | 97.4 | 97.7 | 97.7 | ||
| Career Vision: Motivation in current position (out of 5) (point) | 4.13 | 4.32 | 4.08 | ||
| Career Vision: Satisfaction with current position (out of 5) (point) | 3.82 | 4.04 | 3.81 | ||
| Number of employees holding other positions concurrently (people) | 136 | 126 | 149 | ||
| Number of employees submitting entries to the “Walk the Walk—Yatte Minahare Award”*3 (entry) | 482 | 452 | 475 | Suntory Group | |
| Number of employees joining the FRONTIER DOJO internal entrepreneurship project*4 (entry) | 105 | 113 | 111 | Suntory Group companies in Japan | |
| Number of employees attending the Career Workshop*5 | |||||
| Third year since hiring (people) | 127 | 138 | 161 | Full-time employees of Suntory Holdings Limited and Suntory Beverage & Food Japan | |
| Tenth year since hiring (people) | 160 | 187 | 222 | ||
| For employees in their 40s*6 (people) | 288 | 259 | 262 | ||
| For employees in their 50s (people) | 181 | 117 | 485 | ||
| Number of career support interviews held by the Career Development Center (interview) | 1,929 | 2,448 | 2,872 | ||
-
*1This is an initiative that contributes to the growth of individual businesses and the personal growth of employees by cultivating new capabilities in a manner which is free from preconceived ideas.
-
*2Career Vision interviews are held for each employee once a year, to provide an opportunity for employees to think about their career through discussion with a manager, with the aim of “fostering the growth of individual employees through self-directed career development, and ensuring the effective utilization of human talent, including making sure that the right people are in the right positions.”
-
*3The “Walk the Walk—Yatte Minahare Award” is presented to teams that embody the “Yatte Minahare” spirit through the undertaking of original activities that challenge preconceptions and conventional methods.
-
*4In-house venture project started in 2021 to generate innovation and create the Suntory of the future
-
*5The Career Workshop is implemented in milestone years to provide an opportunity, in the form of a workshop, for employees to think about their careers, with the aim of “Enhancing career development over the medium to long term, and promoting more self-directed career management.”
-
*6Total of mandatory training for employees aged 43 and application-based (elective) training for employees in their 40s
Learning
| Learning | 2023 | 2024 | 2025 | Scope | ||
|---|---|---|---|---|---|---|
| Training expenditure per employee per year (yen) | 368,000 | 392,000 | 321,000 | Employees of Suntory Holdings Limited and Suntory Beverage & Food Japan | ||
| Suntory Self-Development Program | ||||||
| Number of employees participating in voluntary training (people) | 2,757 | 1,942 | 1,739 | Employees of Suntory Holdings Limited and Suntory Beverage & Food Japan | ||
| Number of employees undertaking e-learning (people) | 1,042 | 2,054 | 1,612 | |||
| Total number of participants in the Terakoya program*1 (people) | 29,524 | 25,504 | 23,912 | Suntory Group companies in Japan | ||
| Number of employees participating in global talent cultivation initiatives | ||||||
| Global Leadership Forum (people) | 21 | 18 | 0 | Suntory Group | ||
| Suntory Harvard Program (people) | 20 | 0 | 18 | |||
| Beyond Borders (people) | 26 | 26 | 20 | |||
| Global Leadership Development Program (people) | 50 | 24 | 26 | |||
| Ambassador Program (people) | 0 | 27 | 0 | Suntory Group companies outside of Japan | ||
| Total number of trainees successfully completing the program (people) | 20 | 26 | 19 | Full-time employees of Suntory Holdings Limited and Suntory Beverage & Food Japan | ||
-
*1A learning platform based on the concepts of "learning," "connecting," and "teaching each other" to foster a culture of more proactive learning
Diversity
| Gender | 2023 | 2024 | 2025 | Scope | |
|---|---|---|---|---|---|
| Percentage of new hires that are female (%) | 49.5 | 46.0 | 32.0 | Full-time employees of Suntory Holdings Limited and Suntory Beverage & Food Japan | |
| Percentage of female employees (%) | 27.5 | 28.4 | 26.0 | Full-time employees of Suntory Holdings Limited and Suntory Beverage & Food Japan | |
| Percentage of female employees by age group | |||||
| 20s (%) | 44.9 | 46.1 | 34.2 | Full-time employees of Suntory Holdings Limited and Suntory Beverage & Food Japan | |
| 30s (%) | 32.1 | 33.2 | 31.4 | ||
| 40s (%) | 23.0 | 24.5 | 22.3 | ||
| 50s (%) | 20.6 | 20.2 | 20.0 | ||
| 60s (%) | 16.8 | 17.1 | 16.2 | ||
| Number of female managers (people) | 215 | 238 | 253 | Full-time employees of Suntory Holdings Limited and Suntory Beverage & Food Japan | |
| Percentage of female managers (%) | 11.8 | 12.5 | 13.0 | ||
| Number of female Executives (people) | 7 | 9 | 10 | Suntory Holdings Limited and Suntory Beverage & Food Japan | |
| Percentage of female Executives (%) | 10.6 | 12.9 | 14.9 | ||
| Female employees’ salary as a percentage of male employees’ salary*1 | |||||
| All employees (%) | 72.1 | 71.8 | 77.2 | Employees of Suntory Holdings Limited and Suntory Beverage & Food Japan | |
| Of which, regular employees (%) | 72.4 | 71.9 | 77.4 | Full-time employees of Suntory Holdings Limited and Suntory Beverage & Food Japan | |
| Of which, non-regular employees (%) | 52.8 | 73.3 | 88.7 | Suntory Holdings Limited and Suntory Beverage & Food Japan non-regular employees | |
-
*1At Suntory, there are no differences in wage structure or personnel system between men and women performing the same work. However, there are disparities as shown due to differences in average age, years of service, and the ratio of employees in managerial positions, etc. We will continue to increase the ratio of female new hires and female managers in order to eliminate disparities such as those shown above and to create an organization where each employee can play an active role regardless of gender.
| Balancing work responsibilities with childcare and nursing care responsibilities | 2023 | 2024 | 2025 | Scope | ||
|---|---|---|---|---|---|---|
| Number of female employees taking childcare leave (people) | 104 | 96 | 108 | Full-time employees of Suntory Holdings Limited and Suntory Beverage & Food Japan | ||
| Percentage of employees taking childcare leave, etc. (%) | 96.3 | 105.5 | 94.7 | |||
| Percentage of employees returning to work after childcare leave (%) | 97.1 | 92.3 | 97.1 | |||
| Number of male employees taking childcare leave (people) | 205 | 200 | 235 | |||
| Percentage of employees taking childcare leave,etc*1 (%) | 98.1 | 111.7 | 108.2 | |||
| Percentage of employees returning to work after childcare leave (%) | 99.4 | 98.7 | 98.5 | |||
| Number of new Job-Return program registrants for the year (people) | 6 | 8 | 8 | |||
| Number of employees taking nursing care leave (people) | 2 | 2 | 3 | |||
| Number of employees making use of company-arranged home help services (people) | 2 | 2 | 0 | |||
-
*1The rate of men taking childcare leave, etc. is calculated using the method stipulated in Article 71-4, Paragraph 1 of the Ordinance for Enforcement of the Act on Childcare Leave, Caregiver Leave, and Other Measures for the Welfare of Workers Caring for Children or Other Family Members, which came into effect on April 1, 2023.
| Senior employees | 2023 | 2024 | 2025 | Scope | ||
|---|---|---|---|---|---|---|
| Number of employees re-employed by the company at the age of 65 (people) | 36 | 24 | 31 | Full-time employees of Suntory Holdings Limited and Suntory Beverage & Food Japan | ||
| Percentage of employees re-employed by the company at the age of 65 (%) | 39 | 34 | 36 | |||
| Disability | 2023 | 2024 | 2025 | Scope | ||
|---|---|---|---|---|---|---|
| Number of employees who have a disability (people) | 117 | 118 | 123 | Regular employees of Suntory Holdings Limited* | ||
| Percentage of employees who have a disability (%) | 2.97 | 2.84 | 2.57 | |||
| Number of employees who have a disability (people) | 41 | 40 | 56 | Regular employees of Suntory Beverage & Food Japan* | ||
| Percentage of employees who have a disability (%) | 2.62 | 2.73 | 2.69 | |||
- *Calculated based on the calculation method for employment rate standards established by the Ministry of Health, Labour and Welfare (as of June 1, 2025)
Workstyles
| Workstyles | 2023 | 2024 | 2025 | Scope | |
|---|---|---|---|---|---|
| Average number of days of annual paid leave taken*1 (day) | 17.6 | 16.7 | 16.7 | Full-time employees of Suntory Holdings Limited and Suntory Beverage & Food Japan | |
| Average overtime hours worked per month (hour) | 19.4 | 19.9 | 18.7 | Suntory Group companies in Japan*2 | |
-
*1Encourage all employees to take at least 16 days of paid leave per year
-
*2Includes Suntory Holdings Ltd., Suntory Beverage & Food Ltd., Suntory Spirits Ltd., Suntory Products Ltd., Suntory Foods Ltd., Suntory Business Systems Ltd., Suntory Wellness Ltd. and Suntory Global Innovation Center Ltd.
Occupational Safety
| Occupational Safety | 2023 | 2024 | 2025*1,2 | Scope | |
|---|---|---|---|---|---|
| Occupational accident severity rate (%) | 0.001 | 0.001 | 0.005 | Suntory Group companies in Japan | |
| Lost time incident rate (LTIR) | 0.21 | 0.14 | 0.13★ | ||
| Number of employees undergoing occupational health and safety education (people) | 656 | 768 | 927 | ||
| Total annual hours worked per employee (hour) | 1,846 | 1,857 | 1,866 | ||
| Deaths due to occupational accidents (people) | 0 | 0 | 0 | Full-time employees of Suntory Holdings Limited and Suntory Beverage & Food Japan | |
-
*1Occupational accidents involving full-time employees, special contract employees and part-time employees, and others working at the following Suntory Group companies are included: Suntory Holdings Ltd., Suntory Beverage & Food Group, (Suntory Beverage & Food Ltd., Suntory Foods Ltd., Suntory Products Ltd.), Suntory Spirits Ltd., Suntory Wellness Ltd., Suntory Business Systems Ltd., and Suntory Global Innovation Center Ltd.
-
*2Lost time incident rate (LTIR) = Number of casualties due to occupational accidents (absence of 4 days or more) ÷Total hours worked×1 million hours
Labor Practices
| Labor Practices | 2023 | 2024 | 2025 | Scope | |
|---|---|---|---|---|---|
| Percentage of employees with the legal right to engage in collective bargaining (%) | 52.5 | 52 | 59.5 | Full-time employees of Suntory Holdings Limited and Suntory Beverage & Food Japan | |
| Number of reports made to hotline (cases) | 232 | 386 | 382 | Suntory Group | |
Health
| Health | 2023 | 2024 | 2025 | Scope | |
|---|---|---|---|---|---|
| Percentage of employees having a health examination (%) | 100.0 | 100.0 | 100.0 | Suntory Group companies in Japan*3 | |
| Percentage of employees having a further examination or in-depth examination (%) | 91.1 | 89.5 | 92.1 | ||
| Percentage of employees eligible for specific health guidelines (%) | 21.4 | 21.7 | 21.6 | ||
| Percentage of smokers who are non-smokers or currently quitting smoking (%) | 83.1 | 83.2 | 83.6 | ||
| Percentage of employees having stress checks (%) | 90.5 | 94.5 | 95.5 | ||
| Percentage of employees found not to have high stress levels (%) | 91.9 | 92.8 | 91.6 | ||
| Presenteeism*1 (%) | 79.8 | 80.3 | 78.3 | ||
| Absenteeism (number of days absence due to injury or illness)*2 (day) | 0.7 | 0.6 | 0.6 | ||
-
*1Work productivity (4-week average), with 100% representing no injuries or illness.
-
*2Number of days on which employees are unable to work due to feeling unwell (3-month average)
2025 response rate for presenteeism and absenteeism: 95.5%; number of respondents: 7,887 -
*3Includes Suntory Holdings Ltd., Suntory Beverage & Food Ltd., Suntory Spirits Ltd., Suntory Products Ltd., Suntory Foods Ltd., Suntory Business Systems Ltd., Suntory Wellness Ltd. and Suntory Global Innovation Center Ltd.
Engagement
| Community Engagement | 2023 | 2024 | 2025 | Scope | |
|---|---|---|---|---|---|
| Engagement Survey response rate (%) | 96 | 93 | 95 | Suntory Group companies in Japan*1 | |
| Percentage of Favorable Respondents Regarding Pride in Working for Suntory Group (%) | 85 | 86 | 86 | ||
| Proud to work for Suntory Group (out of 100) (point) | 81 | 81 | 82 | ||
| Percentage of favorable respondents regarding satisfaction with company (company they work for) (%) | 69 | 71 | 74 | ||
| Satisfaction with company (company you work for) (out of 100) (point) | 70 | 71 | 72 | ||
-
*1Includes Suntory Holdings Ltd., Suntory Beverage & Food Ltd., Suntory Spirits Ltd., Suntory Products Ltd., Suntory Foods Ltd., Suntory Business Systems Ltd., Suntory Wellness Ltd. and Suntory Global Innovation Center Ltd.
2025: 95% response rate and 7,497 respondents
Global Data
Employee Number (Y2025)
| Region - Employee number | 41,628 | |
|---|---|---|
| Japan (people) | 20,053 | |
| Americas (people) | 7,568 | |
| Europe (people) | 4,887 | |
| Asia, Oceania (people) | 9,120 | |
| Business - Employee number | 41,628 | |
|---|---|---|
| Beverages & Food (people) | 22,700 | |
| Liquor (people) | 9,560 | |
| Others (people) | 7,811 | |
| Corporate (common) (people) | 1,557 | |
Diversity (Y2025)
| Suntory Beverage & Food (Asia, Oceania) | Suntory Beverage & Food (Europe) | Suntory Global Spirits Inc. | Suntory Japan*1 | ||
|---|---|---|---|---|---|
| Percentage of new hires that are female (%) | 38 | 39 | 36 | 32 | |
| Percentage of female employees (%) | 30 | 37 | 37 | 26 | |
| Percentage of female managers (%) | 47 | 43 | 46 | 13 | |
| Percentage of female Executives (%) | 14 | 27 | 22 | 15 | |
-
*1People based in Suntory Holdings Limited and Suntory Beverage & Food Japan.
Engagement (Y2025)
| Suntory Beverage & Food (except for Japan) | Suntory Global Spirits Inc. | Suntory Japan*1 | |
|---|---|---|---|
| Engagement Survey score (out of 100 points) (points) | 78 | 78 | 72 |
-
*1People based in Suntory Holdings Limited, Suntory Beverage & Food Japan, Suntory Spirits Ltd., Suntory Products Limited, Suntory Foods Limited, Suntory Business Systems Ltd., Suntory Wellness Ltd. and Suntory Global Innovation Center Ltd.