- Suntory Beverage & Food
- > News Release
- > Suntory Water Report
News Release
- No.SBF0557(2017/8/1)
-

Suntory Water Report
– Consumption of small-volume(*1) mineral water is growing
From daily consumption to emergency stock, types of use are expanding –
■ Water market in Japan
Since launching on the commercial market in the early 1970s, increasing demand for clean, delicious water and interest in the beauty and health benefits of water has propelled the mineral water market to continuous growth to a point where it is now a part of peoples’ everyday lives. The Japanese market, which grew following the Great East Japan Earthquake, saw more growth in 2016 that pushed it to record levels. 2016 saw a particular increase in domestic mineral water production volume. At the same time, per capita consumption of mineral water reached record levels and was 1.5 times higher compared to 10 years earlier (2006).
With lifestyle changes, how people use and consume mineral water is also changing. In 2017, more consumers are choosing small-volume PET bottles.
Recent years also have seen flavored water and sparkling water permeate and become a regular part of consumer lifestyles.
In addition to growth of the mineral water market, growth on the flavored water and sparkling water markets demonstrates the overall vitality of the drinking water market.
*1 Small-volume refers to products 650ml and smaller.
■ Results for 2017 consumption trends
<Consumption frequency / consumption occasions>
◆Small-volume mineral water consumption frequency is increasing.
◆In particular, the number of people consuming small-volume mineral water at home is increasing.
<Bulk purchasing>
◆In the past year, the percentage of consumers who purchased cases of mineral water was approximately 45% for both small-volume and large-volume*2 mineral water. The percentage of people who purchased cases of mineral water was nearly the same for both small-volume and large-volume products.
<Purchasing for reserves>
◆Approximately 60% of people purchase mineral water for reserves. The number of people who purchase small-volume mineral water for daily consumption and to maintain a reserve for emergency situations is increasing.
*2 Large-volume refers to products 1.5L and larger
I. Consumer trends survey
This is the 2017 edition of the consumer drinking water trends survey that Suntory Beverage & Food Limited (SBF) has conducted since 1991. The following is a report on the current state and future outlook on consumer trends for mineral water as well as sparkling water and flavored water.
II. Reference: About transitions in the Japanese water market
I. Consumer trends survey
| State of mineral water and other drinking water consumption |
1. Survey overview
Today, mineral water has become a vital part of our daily lives.
Suntory Beverage & Food Limited (SBF) has conducted market trend surveys annually since 1991 for the purpose of analyzing how mineral water is consumed as well as consumption frequency, motivation, and preferences. Since 2003, the scope of this survey has no longer been limited to people who drink mineral water at home. The survey scope includes all consumers and covers consumer mentality and style of use for all drinking waters, which includes mineral water. Furthermore, since 2010, the survey method was changed from direct interviews to internet-based surveys.
Drinking water market trend survey
1. Survey target
Targeted individual men and women age 20 – 69 living in the Metropolitan region (Tokyo Kanagawa, Chiba, and Saitama prefectures) and Kansai region (Osaka, Kyoto, Hyogo, and Nara prefectures) who have purchased one of the following six types of waters or who used tap water as “drinking water” since June of last year.
a) Mineral water (non-carbonated, non-sweetened water sold in PET bottles, cans, or bottles)
b) Carbonated water or sparkling water
c) Flavored water
d) Mineral water home delivery services (in-home water server)
e) Supermarket and other self-service water filling stations
f) In- home water purification (water from alkaline ion water purifiers installed directly on the water pipe)
2. Survey size
500 people (253 men, 247 women)
3. Survey method
Internet questionnaire
4. Survey period
June 2 – June 4, 2017
An overview of survey results is as follows.
2. Major survey results
(1) Drinking water consumption rates over the past one year
- Rate of mineral water consumption was highest at 88.0%.
(2) Mineral water consumption frequency by product volume
- Compared to one year ago, small-volume mineral water consumption frequency increased.
(3) Drinking occasions for small-volume mineral water
- In particular, the number of people consumer small-volume mineral water at home, for example after bathing and right after waking up, is increasing.
(4) Mineral water purchasing methods
- For both small-volume and large-volume, the percentage of people who purchase in cases was approximately 45%.
(5) Mineral water for reserves
- The percentage of people who purchase mineral water for reserves was 57%. People purchasing small-volume mineral water for reserves is increasing as people view small-volume products convenient for both daily consumption and emergency situations.
(6) Perceived places/ideal images of source for mineral water
- Place thought of as source for mineral water is the Minami-Alps. Preferred location is a place with a vast forest protecting the water source.
(7) Rate of consumption and gender and age-based changes in flavored water consumption
- 46% reported consuming flavored water. Rate of consumption increased for both men and women in their 20s. Consumption frequency among consumers also increased.
(8) Rate of consumption and consumption methods of sparkling water
- The rate of consumption for sparkling water was 57.8%. A growing number of people are drinking it as is.
(9) Freezer-safe PET bottles rate of recognition and rate of use
- Compared to one year ago, both rate of recognition and rate of use increased. Freezer-safe PET bottles are being used not only in outdoor situations such as going for a drive or excursions, but also for everyday consumption occasions at home.
(10) Reasons for using mineral water home delivery services (water servers)
- Reasons for use of mineral water home delivery services include taste, peace of mind, and convenience.
(11) Future interest in consuming drinking water
- Regarding future interest in consuming drinking water, mineral water was highest. Interest in sparkling water and flavored water grew.
3. Detailed survey results
(1) Drinking water consumption rates over the past one year
| Rate of mineral water consumption was highest at 88.0%. |
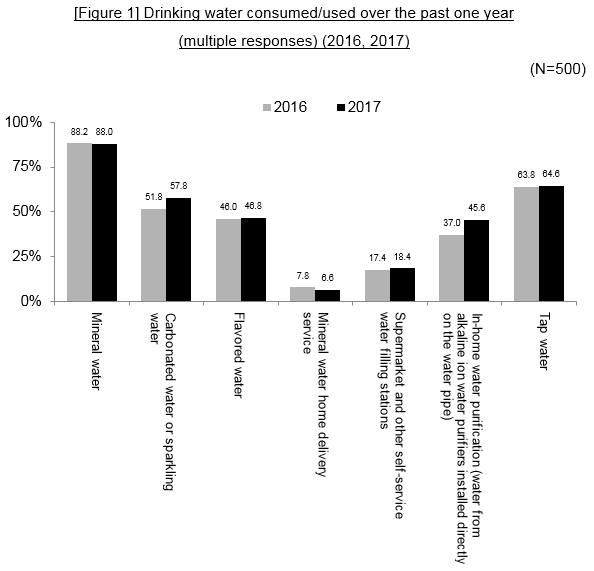
Regarding the seven types of drinking water – mineral water (non-carbonated, non-sweetened water sold in PET bottles, cans, or bottles), carbonated water or sparkling water, flavored water, mineral water home delivery services, supermarket and other self-service water filling stations, in-home water purification, and tap water – we researched consumption rates (rate of consumption/use) for the past one year. Results showed that mineral water had the highest rate of use at 88.0%. Compared to one year ago, the rate of consumption for carbonated water or sparkling water increased. (Figure 1)
 |
(2) Mineral water consumption frequency by product volume
| Compared to one year ago, small volume mineral water consumption frequency is increasing. |
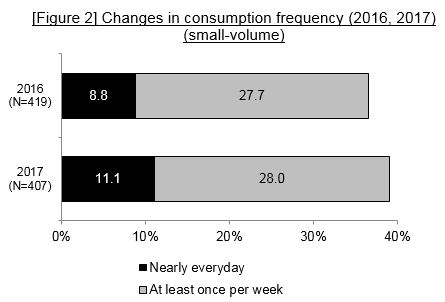
We compared consumption frequency mineral water to one year prior.
In 2017, the percentage of people consuming small-volume products at least once per week was 39.1%. Compared to 36.5% in 2016, this indicates that consumption frequency is increasing.
 |
(3) Small-volume mineral water consumption occasions
| In particular, personal consumption at home, including after bathing and right after waking up, is increasing. |
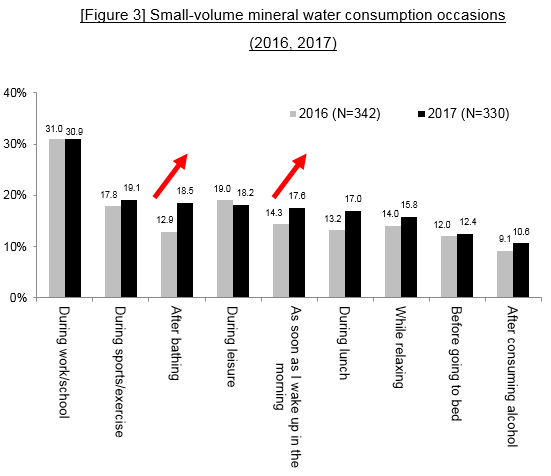
We asked about consumption occasions for small-volume mineral water. “During work/school” (30.9%) was the most common response, followed by “during sports/exercise” (19.1%), “after bathing” (18.5%), and “during leisure” (18.2%).
Compared to 2016, there was an increase in consumption “after bathing” (12.9% > 18.5%), and “as soon as I wake up in the morning” (14.3% > 17.6%). In particular, the number of people consuming small-volume mineral water at home is increasing. (Figure 3)
 |
(4) “Mineral water” purchasing methods
| Consumers purchase cases of both small-volume and large-volume at nearly the same rate, approximately 45%. |
With the increased rate of small-volume mineral water consumption during daily occasions, we asked consumers how they purchase their mineral water.
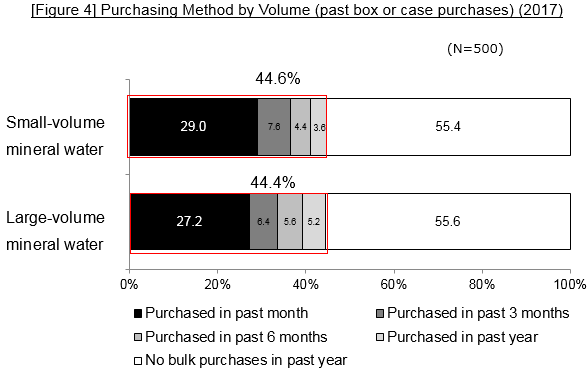
We asked consumers if they had purchased small-volume mineral water by the case in the past year. Nearly 30% (29.0%) had made a purchase in the past month, 7.6% had made a purchase in the past three months, 4.4% had made a purchase in the past six months, and 3.6% had made a purchase in the past year. In total, 44.6% had purchased small-volume mineral water by the case in the past year.
The percentage of people who had purchased large-volume mineral water by the case in the past year was 44.4%, indicating that the percentage of people making purchases by the case was nearly identical for both small-volume and large-volume mineral water. (Figure 4)
 |
(5) About purchasing mineral water for reserves
| 57% of people purchase mineral water for reserves Number of people purchasing small-volume mineral water for reserves is increasing because it is convenient for both emergency situations and daily consumption. |
We asked people if they purchase mineral water for reserves. 57% responded to the affirmative.
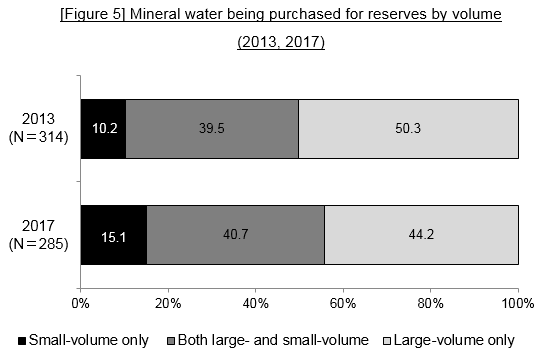
In response to the question of what size mineral water they purchase for reserves, 15.1% responded “small-volume only”, 40.7% responded “both large-volume and small-volume”, and 44.2% responded “large-volume only”. Compared to the previous survey in 2013, there is no change in the percentage of people purchasing “both large-volume and small-volume” but “large-volume” consumers only declined while “small-volume only” consumers increased. (Figure 5)
 |
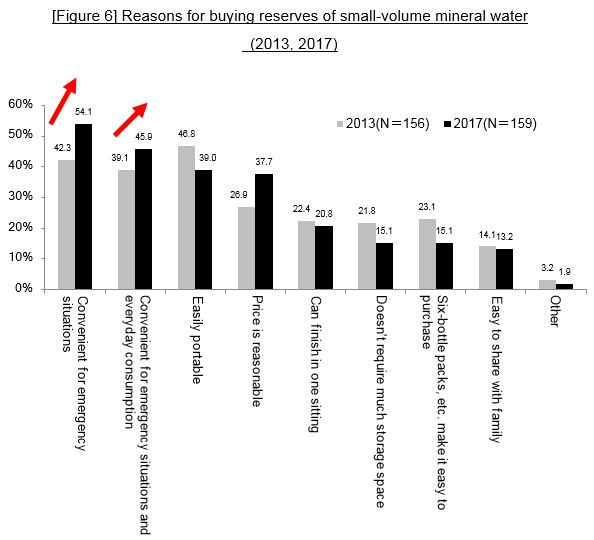
As reasons for buying reserves of small-volume mineral water, over half (54.1%) responded that “it would be convenient for emergency situations”. Compared to 2013, responses increased for both “it would be convenient for emergency situations” (42.3% > 54.1%) and “it would be convenient for emergency situations and everyday consumption” (39.1% > 45.9%), indicating that the number of people purchasing small-volume mineral water for reserves is increasing because small-volume mineral water is viewed as “convenient” for all types of situations. (Figure 6)
 |
(6) Perceived places/ideal images of source for mineral water
| Place thought of as source for mineral water is the Minami-Alps. Preferred location is a place with a vast forest protecting the water source. |
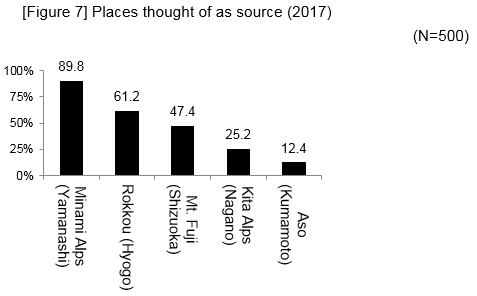
We asked survey participants the place that comes to mind when they imagine location from which mineral water is sourced. The Minami-Alps (Yamanashi Prefecture) was No. 1 again in 2017. Over 90% of survey participants envision the Minami-Alps as the location from which mineral water is drawn. (Figure 7) This marks the fifth consecutive year at No. 1 since we began conducting this survey in 2013.
 |
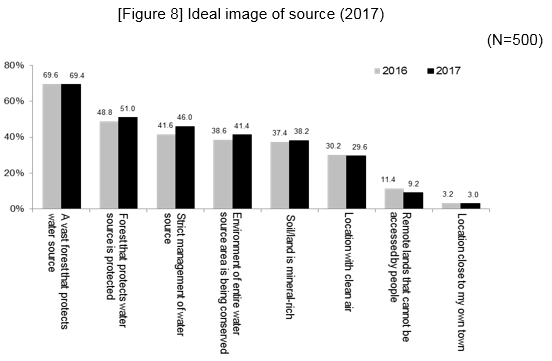
We asked respondents about their ideal image of a water source for mineral water. As with last year, approximately 70% reported preferring a location with “a vast forest that protects water source.” (Figure 8)
 |
(7) Rate of consumption and gender and age-based changes in flavored water consumption
| 46.8% reported consuming flavored water. Rate of consumption increased among men and women in their 20s. Consumer frequency of consumption also increased. |
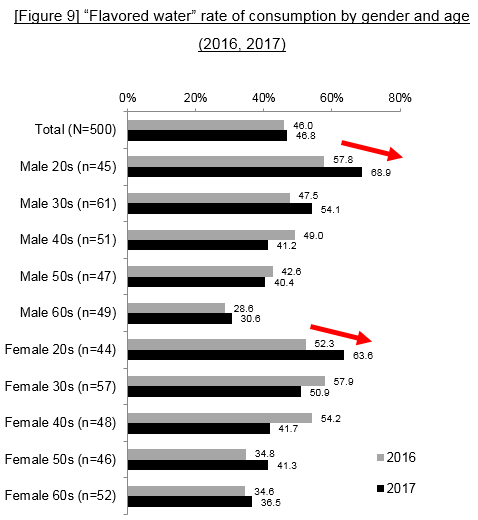
We asked people if they have consumed “flavored water” in the past year. The rate of consumption for “flavored water” was 46.8%, indicating that nearly half of consumers have consumed “flavored water” in the past year.
Looking at people who consumed flavored water in the past year based on gender and age, the rate of consumption was highest among males in their 20s (68.9%). Compared to one year ago, rates for men in their 20s increased from 57.8% to 68.9% and rates for women in their 20s increased from 52.3% to 63.6%. The increase among both men and women was significant. (Figure 9)
 |
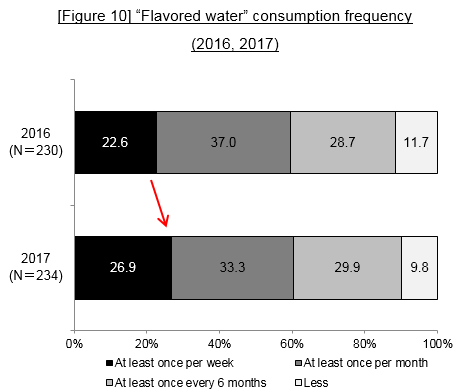
Also, looking at consumption frequency, the percentage of people consuming at least once per week was 26.9%, up approximately 4 points compared to last year. (Figure 10)
 |
(8) Rate of consumption and consumption method for sparkling water
| Sparkling water rate of consumption was 57.8%. An increasing number of people consumption sparkling water as is. |
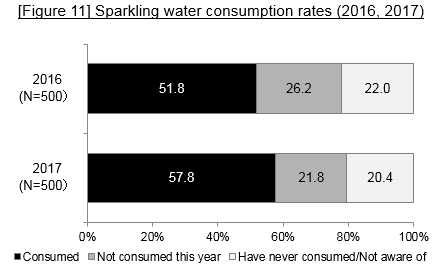
During the past year, the percentage of people who consumed sparkling water was at 57.8%.
This is a significant increase compared to last year (51.8%). (Figure 11)
 |
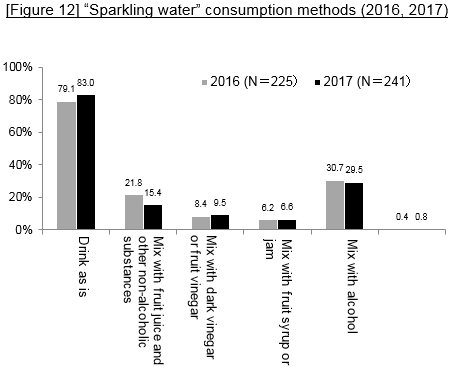
We also asked people who had consumed carbonated water or sparkling water in the past year how they consumed it. The most common response was “drink as is”, which also increased compared to last year. (Figure 12)
 |
(9) “Freezer-safe PET bottles” rate of recognition and use
| Compared to one year ago, both rate of recognition and use increased. In addition to outdoor occasions such as going on a drive or excursion, consumers are also enjoying this type of consumption inside the home. |
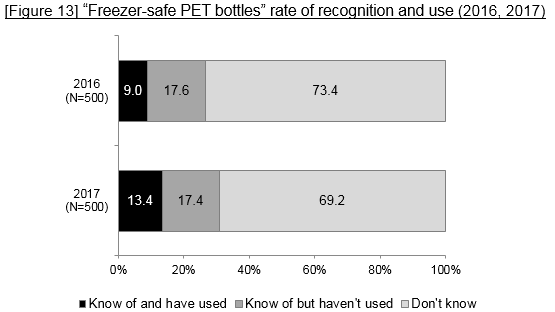
“Freezer-safe PET bottles” have seen increasing popularity in recent years. With 13.4% responding that they know of and have used “freezer-safe PET bottles” and 17.4% responding that they know of but have not used “freezer-safe PET bottles”, responses show that over 30% (30.8%) of consumers know of “freezer-safe PET bottles”, indicating that both recognition and use are increasing. (Figure 13)
 |
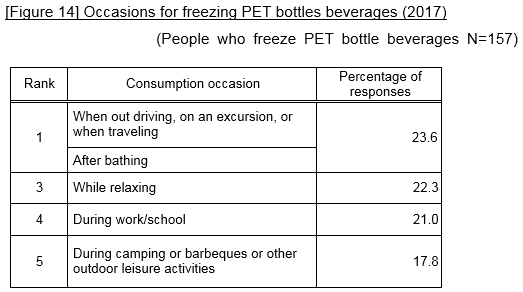
We asked people who have used “freezer-safe PET bottles” or otherwise frozen PET bottle beverages about their consumption occasions. The most common responses were “when out driving, on excursion, or when travelling” and “after bathing” (both 23.6%). In addition to outdoor occasions, consumers are also enjoying this type of consumption inside the home. (Figure 14)
 |
(10) Reasons for using mineral water home delivery services (water servers)
| Reasons for use of mineral water home delivery services include taste, peace of mind, and convenience. |
The percentage of people using mineral water home delivery services was 6.6%, representing no significant change from one year ago (7.8%). (refer Figure 1)
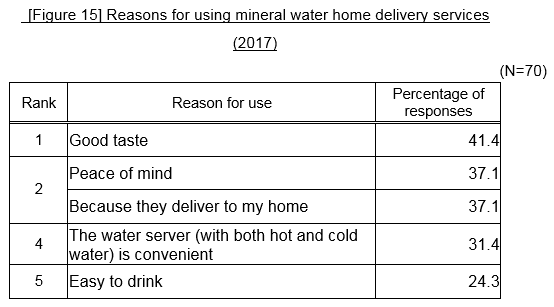
We asked people who currently or in the past have used mineral water home delivery services their reasons for using the service. Top responses were “Good taste” (41.4%), “Peace of mind” (37.1%), and “Because they deliver to my home” (37.1%). (Figure 15)
 |
(11) Future interest in consuming drinking water
| Mineral water was the top response related to future interest in consuming drinking water. Interest in consuming spring water and flavored water increases. |
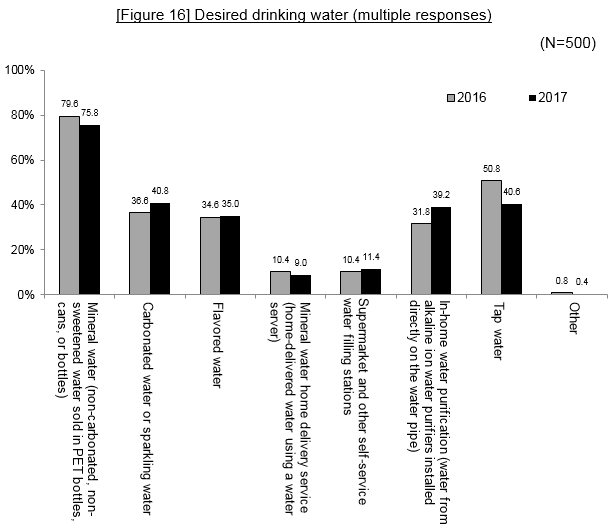
In response to the question of which drinking water you are interested in consuming, the top response this year was again mineral water. Nearly 76% of people want to consume mineral water as drinking water. Desire to consume “carbonated water or sparkling water” (40.8%) and “flavored water” (35.0%) is increasing, suggesting favorable demand trends for the water-based beverage market will continue. (Figure 16)
 |
II. Reference: About transitions in the Japanese water market
The history of mineral water in Japan dates back to the early 1970s when bottled mineral water was first sold on the commercial market. While reflecting the various elements of the times, mineral water has gradually permeated into the Japanese lifestyle over the years.
● Late 1980s: Growth of the general consumer market
Increased familiarity of mineral water driven by the natural and healthy living trends as well as increase overseas travel by Japanese people and growing concerns related to the quality of tap water caused a transition in growth from the commercial to the general consumer market.
● 1990s: Major growth in general consumer market
Entering the 1990s, news media began to report on the cleanliness of apartment building water tanks and issues with tap water. These reports sparked an increase in the consumption of mineral water among general consumers. Domestic mineral water grew as an alternative to tap water and a boom in 1993 also saw import volume grow.
An extremely hot summer and water shortage in 1994 resulted in increased demand and increased awareness about the need for emergency reserves. These factors helped establish mineral water’s position as a household product. However, imported mineral water decreased dramatically following a contamination scandal in autumn 1995 and in 1996 the consumer mineral water market sales underperformed previous year sales for the first time in the 1990s. However, this incident created a higher level of consumer awareness regarding mineral water safety as quality reliability became the key impetus for consumer purchases.
In April 1996, Japan allowed the sale of domestically produced small-volume PET bottle products. This increased occasions for mineral water consumption and resulted in a significant increase in volumes of domestic mineral water.
The so-called “Y2K Problem” caused many people to stock mineral water in their homes out of concerns about power outages and mineral water sales in 1999 increased by 30% compared to the previous year.
● 2000s: Market growth with increase in health consciousness. 2016 was 104% year on year, representing record high volume.
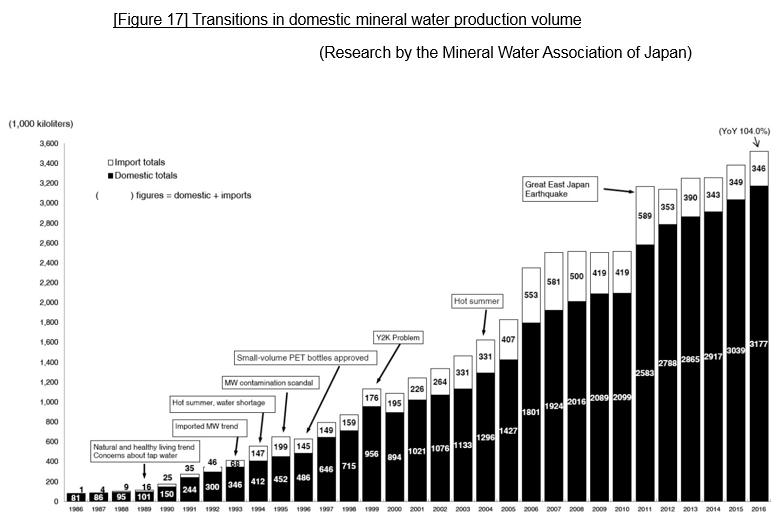
From 2000 to 2006, increase health consciousness drove the growth in the mineral water market but from 2007 the market was stagnant due in part to consumer pessimism. In 2011, the sudden demand for reserves seen following the Great East Japan Earthquake with sales jumping from 3,172,000 kiloliters (year on year increase from 126.0%). This was represented an 11-fold increase over twenty years ago and a 2.5-fold increase compared to 10 years ago. (Figure 17: according to Mineral Water Association of Japan research)
In 2016, domestic mineral water production volume (domestically produced mineral water) was 3,177,000 kiloliters (104.5% year on year), and volume of imported mineral water was 346,000 kiloliters (99.3% year on year). This represents a total of 3,523,000 kiloliters, a record high volume.
In particular, domestic mineral water production volume has increased annually since 2001.
 |
● Japanese domestic per capita annual consumption trends
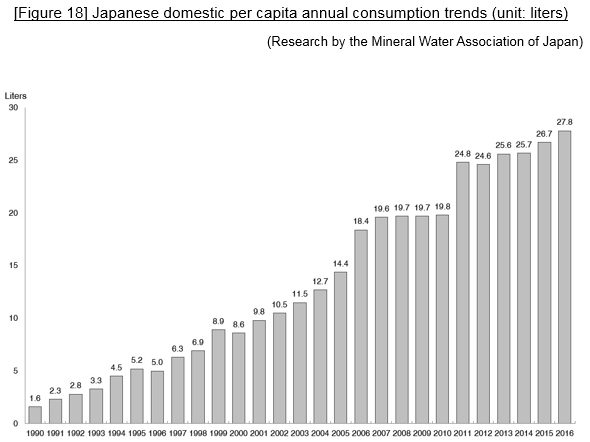
From 2007, Japanese domestic per capital annual mineral water consumption held steady at around 19.7 liters. In 2011, due in part to the impact of the Great East Japan Earthquake, this grew significantly to 24.8 liters. In 2016, this further increased to 27.8 liters, the highest level thus far. (Figure 18: according to Mineral Water Association of Japan research).
 |
