Sustainability Data
Performance Data
Suntory Beverage & Food Group has brought together its performance for the main indicators (management, environment, and society) on our sustainability site and other media.
Actual results marked with ★ have been independently assured by KPMG AZSA sustainability Co., Ltd. in accordance with International Standard on Assurance Engagement (ISAE) 3000 and ISAE 3410.
Key Financial Data
Revenue
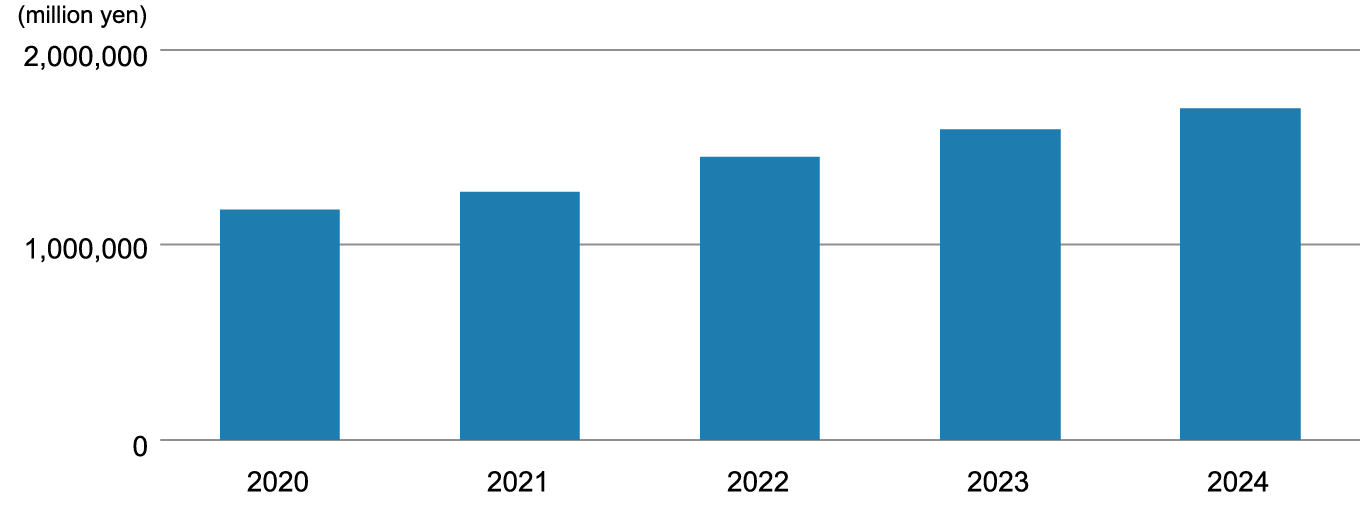
(million yen)
| 2020 | 2021 | 2022 | 2023 | 2024 | |
|---|---|---|---|---|---|
| Revenue | 1,178,137 | 1,268,917 | 1,450,397 | 1,591,722 | 1,696,765 |
Operating Income
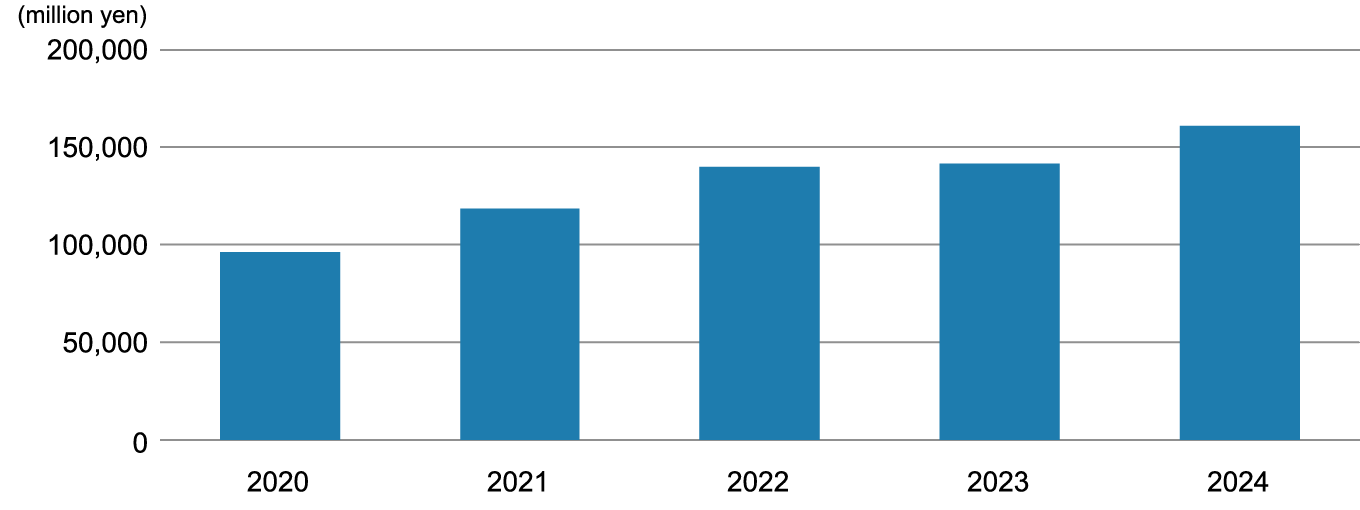
(million yen)
| 2020 | 2021 | 2022 | 2023 | 2024 | |
|---|---|---|---|---|---|
| Operating Income |
96,177 | 118,568 | 139,688 | 141,726 | 160,249 |
Breakdown by segment (FY2024)
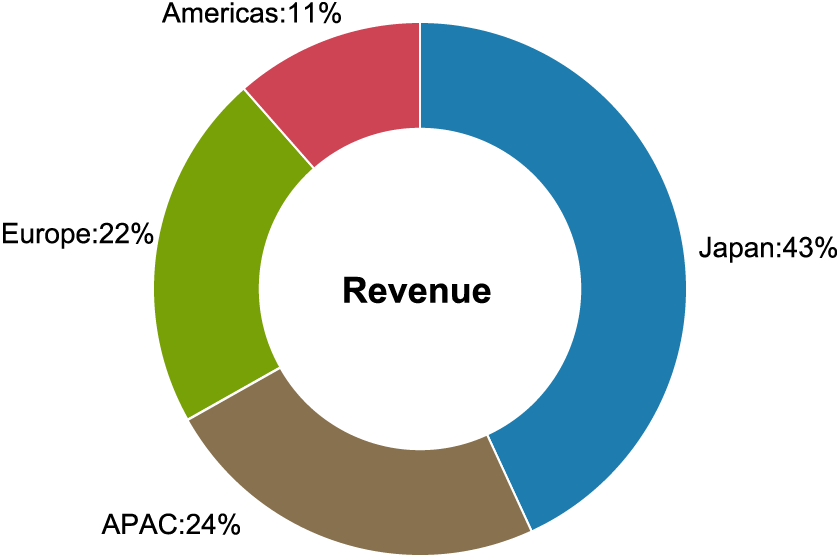
(million yen)
| Year | 2024 |
|---|---|
| Japan | 731,814 |
| APAC | 402,049 |
| Europe | 368,081 |
| Americas | 194,819 |
| Consolidated Total | 1,696,765 |
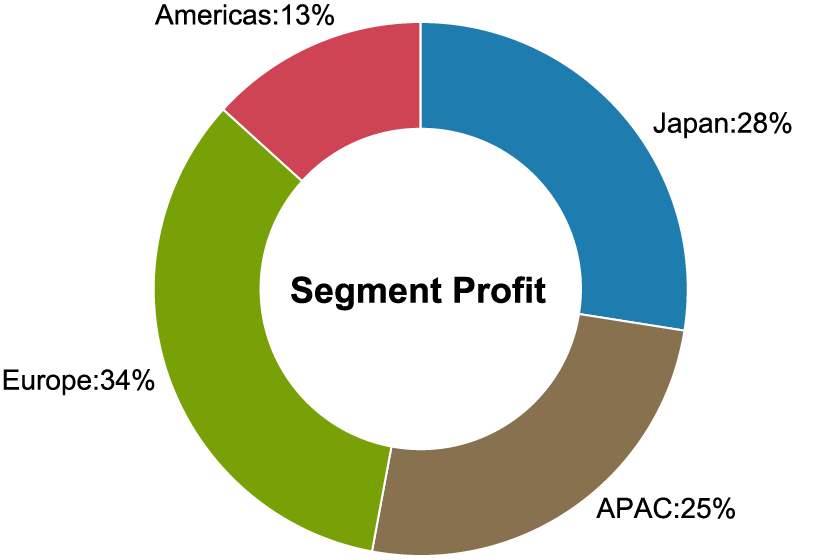
(million yen)
| Year | 2024 |
|---|---|
| Japan | 49,083 |
| APAC | 45,404 |
| Europe | 60,356 |
| Americas | 23,684 |
| Segment Total | 178,529 |
| Reconciliations | -18,279 |
| Consolidated Total | 160,249 |
Environmental Data
Water
Targets Toward & Progress at Suntory Beverage & Food
Targets
Toward
2030
- Reduction of water used in direct operation
Reduce the water intensity of production at our owned plants*1 by 20%*2 globally. In addition, explore reduction of absolute amount of water withdrawn in highly water stressed areas. - Water replenishment
Replenish more than 100% of water used in at least 50% of our owned plants*1 globally, including those in highly water stressed areas, through local water source conservation efforts. - Sustainable water use in raw ingredients
Collaborate with suppliers to improve water-use efficiency in the production of water-intensive key ingredients*3 in highly water stressed areas. - Water education and access to safe water
Expand water education programs and initiatives to provide safe water access for more than 5 million people. *4
2024
Progress
- Reduced per consumption of water by 22% compared to 2015
- Implemented water resource cultivation activities in 33% plants worldwide.
Plants located in highly water stressed areas, activities are implemented in 9% of these areas. - Gain and understand information on water management of tier 1 suppliers through Sedex.
- Water enlightenment program: 1,330,000 people
Provision of safe water: 420,000 people,
Total 1,750,000 people*5
-
*1Owned plants that manufacture finished products and excludes plants for packaging and ingredients
-
*2Reduction of water intensity of production based on 2015 baseline year
-
*3Coffee etc.
-
*45 million people is Suntory group's target
-
*5The total is Suntory Groups's progress.
Water Stewardship at Suntory Beverage & Food
| 2015 (base year) |
2022 | 2023 | 2024 | |
|---|---|---|---|---|
| Total water withdrawal (thousand m3) | - | 22,916 | 22,450 | 21,723★ |
| Water intensity (m3/kl) | 2.9 | 2.3 | 2.3 | 2.2 |
| Total water discharge (thousand m3) | - | 11,948 | 11,682 | 11,699★ |
| Total water consumption (thousand m3) | - | 10,968 | 10,768 | 10,024 |
-
*Suntory Beverage & Food plants that manufacture finished products.
-
*Results have received independent assurance from KPMG AZSA Sustainability Co., Ltd. The assured numerical values are indicated with ★.
Water Withdrawal from Areas at Suntory Beverage & Food
| Area | Water withdrawal (thousand m3) | |||||
|---|---|---|---|---|---|---|
| 2015 (base year) |
2020 | 2021 | 2022 | 2023 | 2024 | |
| Japan | 10,708 | 10,332 | 10,240 | 10,786 | 10,786 | 10,751 |
| Americas | 1,286 | 1,442 | 1,505 | 1,541 | 1,413 | 1,534 |
| Europe | 3,861 | 3,119 | 3,315 | 3,434 | 3,363 | 3,244 |
| Asia | 4,490 | 6,362 | 6,208 | 6,757 | 6,466 | 5,763 |
| Oceania | 562 | 444 | 424 | 397 | 422 | 429 |
| Africa | 216 | 89 | 84 | - | - | - |
| Total | 21,122 | 21,789 | 21,776 | 22,916 | 22,450 | 21,723★ |
-
*Suntory Beverage & Food plants that manufacture finished products.
-
*Results have received independent assurance from KPMG AZSA Sustainability Co., Ltd. The assured numerical values are indicated with ★.
Water Discharge to each destination at Suntory Beverage & Food
| Destination | Water Discharge (thousand m3) | ||||
|---|---|---|---|---|---|
| 2020 | 2021 | 2022 | 2023 | 2024 | |
| Rivers/lakes | 6,767 | 6,703 | 6,689 | 6,757 | 6,589★ |
| Sea | - | - | - | - | - |
| Sewers | 5,370 | 5,740 | 5,259 | 4,866 | 5,110★ |
| Others (for watering plants, etc.) |
- | - | - | 59 | 0 |
| Total | 12,136 | 12,443 | 11,948 | 11,682 | 11,699★ |
-
*Suntory Beverage & Food plants that manufacture finished products.
-
*Results have received independent assurance from KPMG AZSA Sustainability Co., Ltd. The assured numerical values are indicated with ★.
Water Pollution Emissions at Suntory Beverage & Food
| 2022 | 2023 | 2024 | |
|---|---|---|---|
| BOD (t) | 9 | 9 | 11★ |
| COD (t) | - | - | - |
-
*Data covers production plants in Japan that meet following calculation criteria (when discharged into sewage systems, neither BOD nor COD is recorded);
- BOD is recorded when discharged into rivers, COD is recoreded when dischared into marine areas or lakes.
Greenhouse Gas (GHG)
Targets Toward & Progress at Suntory Beverage & Food
Targets
Toward
2030
- Reduce GHG emissions from our direct operations
by 50%*1 - Reduce GHG emissions across our entire value chain
by 30%*1
2024
Progress
- 30% reduction from our direct operations
compared to 2019 - 15% reduction across our entire value chain
compared to 2019
-
*1Based on emissions in 2019
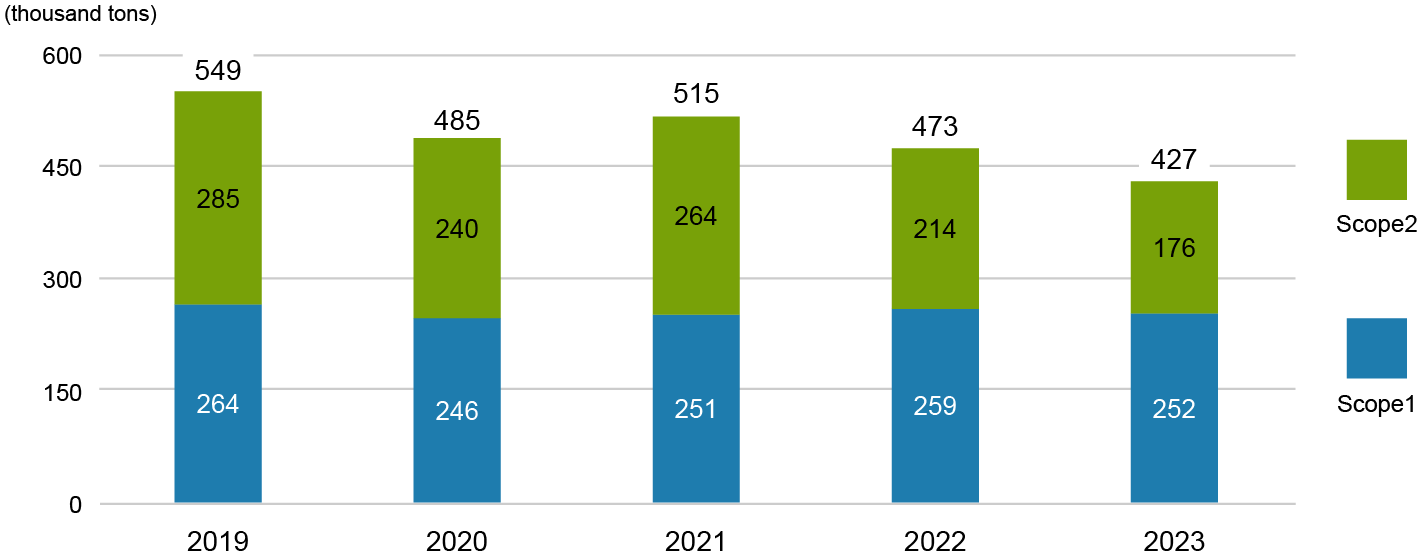
Scope 1 and 2 Emissions by Area at Suntory Beverage & Food
| Area | Scope | GHG emissions (Scope1 : thousand tons CO2e, Scope2 : thousand tons CO2) |
|||
|---|---|---|---|---|---|
| 2019 (base year) |
2022 | 2023 | 2024 | ||
| Japan | Scope 1 | - | 116 | 109 | 112 |
| Scope 2 | - | 24 | 5 | 6 | |
| Scope 1+2 | 218 | 140 | 114 | 118 | |
| Americas | Scope 1 | - | 32 | 32 | 29 |
| Scope 2 | - | 10 | 0 | 0 | |
| Scope 1+2 | 24 | 43 | 32 | 29 | |
| Europe | Scope 1 | - | 50 | 56 | 55 |
| Scope 2 | - | 0 | 0 | 0 | |
| Scope 1+2 | 77 | 50 | 56 | 55 | |
| Asia | Scope 1 | - | 55 | 47 | 38 |
| Scope 2 | - | 179 | 170 | 136 | |
| Scope 1+2 | 204 | 234 | 217 | 173 | |
| Oceania | Scope 1 | - | 6 | 8 | 7 |
| Scope 2 | - | 1 | 1 | 2 | |
| Scope 1+2 | 19 | 7 | 9 | 9 | |
| Africa | Scope 1 | - | 0 | 0 | 0 |
| Scope 2 | - | 0 | 0 | 0 | |
| Scope 1+2 | 8 | 0 | 0 | 0 | |
| Total | Scope 1 | - | 259 | 252 | 240 |
| Scope 2 | - | 214 | 176 | 144 | |
| Scope 1+2 | 549 | 473 | 427 | 385 | |
-
*Out of 385 thousand tons CO2e in the table above, Scopes 1 and 2 emissions of 342 thousand tons CO2e★ (Scope 1: 200 thousand tons CO2e★, Scope 2: 143 thousand tons CO2★) have been independently assured, which do not include emissions of GHG other than GHG emissions at non-production sites outside of Japan. The reporting boundary for the figures independently assured is as follows: production plants in Japan, production plants overseas, and non-production sites in Japan (offices such as main office, training sites, R&D facilities, sales sites)
-
*Results have received independent assurance from KPMG AZSA Sustainability Co., Ltd. The assured numerical values are indicated with ★.
-
*Emission factors for GHG calculation are as follows:
Fuel:
For Japan: Factors specified by the Act on the Rational Use of Energy and the Act on Promotion of Global Warming Countermeasures (using values before revision of the Ministerial Ordinance on Calculation).
For overseas: Factors obtained from fuel suppliers or factors specified by the Act on the Rational Use of Energy and the Act on Promotion of Global Warming Countermeasures (using values before revision of the Ministerial Ordinance on Calculation).
GHG from Electricity consumption:
For Japan: The adjusted emission factors for each electric power company specified by the Act on Promotion of Global Warming Countermeasures.
For overseas: Factors obtained from individual power suppliers or IEA emission factors by country.
GHG other than CO2:
For Japan: Factors specified by the Act on Promotion of Global Warming Countermeasures.
For overseas: Estimated from basic unit calculated from production volume and emissions at plants in Japan (partially based on actual measurements/derived values in accordance with the laws and regulations of each country) -
*The total may not match the sum of each figure due to rounding.
-
*GHG emissions quantification is subject to uncertainty when measuring activity data, determining emission factors, and considering scientific uncertainty inherent in the Global Warming Potentials.
Trends in Scope 1 and 2 Emissions at Suntory Beverage & Food
Energy Consumption at Suntory Beverage & Food
| 2022 | 2023 | 2024 | |
|---|---|---|---|
| Energy Consumption (MWh) | 1,979,441 | 1,953,954 | 1,993,699 |
| Renewable Energy Consumption (MWh) | 364,358 | 477,104 | 487,553 |
| Energy Intensity (MWh/KL) | 0.20 | 0.20 | 0.21 |
| Electricity Consumption (MWh) | - | 726,752 | 715,419 |
-
*Figures for renewable energy and energy consumption have been certified by a third party for results excluding non-production sites outside Japan.
Renewable energy consumption: 485,442MWh★, Electricity consumption: 710,124MWh★
The reporting boundary for the figures externally assured is as follows:
Production plants in Japan, production plants overseas, and non-production sites in Japan (offices such as main office, training sites, R&D facilities, sales sites) -
*Electricity consumption includes in-house generation.
Scope 3 Emissions at Suntory Beverage & Food
| Category | Emissions (thousand tons CO2e) |
Calculation Method |
|---|---|---|
| 1. Purchased goods and services | 3,664★ | [Raw Materials and Packages] Calculated by multiplying the weight of raw materials and packaging materials purchased and used for products manufactured and sold by the Suntory Beverage & Food Group (in Japan and overseas) by the emission factors. A portion of Category 1 GHG emissions are calculated using emission factors calculated from the GHG emissions of suppliers of raw materials and packaging materials. In FY2024, the source of emission factors for raw and packaging materials in Asia and Oceania was updated from IDEA Ver. 3.3 to 3.4 last year, and the Thailand Greenhouse Gas Management Organization(TGO) database was also adopted in some cases. In Europe, emission factors from the Ecoinvent database are mainly adopted. [Contract manufacturers] Calculated by multiplying the volume of the products that Suntory Beverage & Food Group (in Japan and overseas) have outsourced to contract manufacturers by the emission factors. |
| 2. Capital Goods | 384★ | Calculated by multiplying the amount of capital expenditure excluding land expenditure of Suntory Beverage & Food Group by emission factors. |
| 3. Fuel and energy-related activities not included in Scope 1 or 2 | 78 | Calculated by multiplying the amount of energy consumed by Suntory Beverage & Food Group by emission factors related to the collection, production, and transportation of applicable energy resources. |
| 4. Upstream transportation and distribution | 289 | Calculated by multiplying the transportation volume in tons-km of goods owned by Suntory Beverage & Food Group by emission factors. |
| 5. Waste generated in operations | 11 | Calculated by multiplying the weight of waste disposed by Suntory Beverage & Food Group by emission factors. |
| 6. Business travel | 6 | Calculated by multiplying the amount of business travel expenses of Suntory Beverage & Food Group by emission factors. |
| 7. Employee commuting | 18 | Calculated by multiplying the amount of commuting expenses of Suntory Beverage & Food Group by emission factors. |
| 8. Upstream leased assets | 17 | Calculated by multiplying the storage volume as well as the floor area of distribution centers rented by Suntory Beverage & Food Group by emission factors. |
| 9. Downstream transportation and distribution | 194 | Calculated by multiplying the transportation volume in tons-km of Suntory Beverage & Food Group by emission factors. |
| 10. Processing of sold products | — | None |
| 11. Use of sold products | 399 | The emissions of Suntory Beverage & Food Group products at the point of saless and astmospheric emissions when products are opened are calculated by multiplying the sales volume and purchase volume, respectively, by an emission factor. |
| 12. End-of-life treatment of sold products | 235★ | Calculated by multiplying the weight of packaging materials purchased and used by the Suntory Beverage & Food Group by emission factors related to disposal/recycling processing. |
| 13. Downstream leased assets | 431★ | Calculated by multiplying the electricity consumption of Suntory Beverage & Food Group's leased equipment by emission factors. |
| 14. Franchises | 28 | Calculated as Scopes 1 and 2 CO2 emissions from the direct operations of companies and stores franchised by the Suntory Beverage & Food Group. |
| 15. Investments | — | None |
| Total | 5,755 |
-
*The boundary of the scope 3 emissions is the Suntory Beverage & Food Group's beverages and food businesses in Japan and overseas. For some overseas group companies, emissions were estimated by using Japan-based emission factors or production volume in Japan.
-
*The emissions at retail stores and other sales outlets, which had been difficult to calculate in the past, is now included in C11.
-
*Emissions of overseas subsidiaries in C13 is now included in FY2024.
-
*Emission factors used to calculate emissions for Japan include the following:
a) "Emission factor database for corporate GHG emissions accounting over the supply chain (Version 3.5)"
b) "LCI Database IDEA Version 3.4" (IDEA Laboratory, Safety Science Research Division, National Institute of Advanced Industrial Science and Technology) -
*Results have received independent assurance from KPMG AZSA Sustainability Co., Ltd. The assured numerical values are indicated with ★.
-
*GHG emissions quantification is subject to uncertainty when measuring activity data, determining emission factors, and considering scientific uncertainty inherent in the Global Warming Potentials.
Plastic
Targets Toward & Progress at Suntory Beverage & Food
Targets
Toward
2030
- Switch all the PET bottles used globally to be made of recycled or plant-based material by 2030, achieving zero use of virgin petroleum-based materials.
2024
Progress
- Percentage of PET bottles made of recycled or plant-based material: 38%
- Japan
- 58%*
- Overseas
- 23%
-
*Ratio of the number of 100% sustainable bottle
By-Products and Waste Generation
As part of our efforts toward establishing a recycling-oriented society, Suntory Group is working to reduce emissions of by-products and waste and to achieve 100% recycling.
By-Products and Waste Generation Performance at Suntory Beverage & Food
| Area | Amount of discharge (thousand tons) | ||||
|---|---|---|---|---|---|
| 2020 | 2021 | 2022 | 2023 | 2024 | |
| Japan | 84 | 85 | 88 | 86 | 89 |
| Americas | 2 | 2 | 2 | 2 | 0 |
| Europe | 28 | 24 | 34 | 31 | 52 |
| Asia | 31 | 29 | 53 | 32 | 32 |
| Oceania | 7 | 7 | 6 | 3 | 2 |
| Africa | 0 | 0 | 0 | 0 | – |
| Total | 151 | 148 | 184 | 153 | 175 |
-
*Suntory Beverage & Food plants that manufacture finished products.
Recycling Rate of Japanese Plants at Suntory Beverage & Food
| 2020 | 2021 | 2022 | 2023 | 2024 | |
|---|---|---|---|---|---|
| Amount of discharge (thousand ton) | 84 | 85 | 88 | 86 | 89 |
| Amount recycled (thousand ton) | 83 | 85 | 88 | 86 | 89 |
| Recycling rate (%) | 99.1 | 99.3 | 100.0 | 100.0 | 100.0 |
-
*Data covers production plants in Japan.
By-Products and Waste Generation, Recycling Rate and the Purpose of Use for Recycled Products of Japanese Plants at Suntory Beverage & Food
| Type of waste | Main Purpose of Use |
2020 | 2021 | 2022 | 2023 | 2024 | |||||
|---|---|---|---|---|---|---|---|---|---|---|---|
| Generation (t) | Recycling Rate (%) | Generation (t) | Recycling Rate (%) | Generation (t) | Recycling Rate (%) | Generation (t) | Recycling Rate (%) | Generation (t) | Recycling Rate (%) | ||
| Vegetable (glycation, tea, coffee dregs, etc.) |
|
59,840 | 100 | 62,769 | 100 | 64,060 | 100 | 61,225 | 100 | 63,227 | 100 |
| Sludge (excess sludge, etc.) |
|
9,953 | 100 | 9,820 | 100 | 9,066 | 100 | 9,788 | 100 | 9,571 | 100 |
| Wood waste (cask, pallets) |
|
19 | 100 | 17 | 94 | 14 | 100 | 12 | 100 | 22 | 100 |
| Glass and ceramic scrap |
|
527 | 100 | 235 | 100 | 229 | 100 | 216 | 100 | 211 | 100 |
| Paper scraps (cardboards, paper labels, etc.) |
|
3,003 | 100 | 3,114 | 100 | 3,393 | 100 | 3,360 | 100 | 3,492 | 100 |
| Plastic |
|
4,035 | 100 | 3,962 | 100 | 4,169 | 100 | 4,012 | 100 | 3,958 | 100 |
| Metal scraps (aluminum, steel) |
|
1,430 | 100 | 1,351 | 100 | 1,276 | 100 | 1,266 | 100 | 1,124 | 100 |
| Other | 4,710 | 84 | 4,173 | 86 | 5,629 | 100 | 5,687 | 100 | 7,866 | 100 | |
| Total | 83,517 | 99.1 | 85,440 | 99.3 | 87,835 | 100 | 85,566 | 100 | 89,471 | 100 | |
-
*Data covers production plants in Japan.
Social Data
Employment Status of Suntory Beverage & Food
Status at Suntory Beverage & Food (Japan) as of December 31, 2024 is as below.
Number of Employees(as of December 31, 2024)
(employees)
| 2022 | 2023 | 2024 | ||
|---|---|---|---|---|
| Executives | 21 | 20 | 20 | |
| Men | 18 | 15 | 15 | |
| Women | 3 | 5 | 5 | |
| Managers | 512 | 519 | 509 | |
| Men | 476 | 474 | 462 | |
| Women | 36 | 45 | 47 | |
Number of Employees(as of December 31, 2024)
(employees)
| 2022 | 2023 | 2024 | |
|---|---|---|---|
| Men | 1,539 | 1,496 | 1,482 |
| Women | 520 | 546 | 591 |
| Total | 2,059 | 2,042 | 2,073 |
-
※Full-time employees of Suntory Beverage & Food International
Mobility of human resources(as of December 31, 2024)
(employees)
| 2022 | 2023 | 2024 | ||
|---|---|---|---|---|
| Number of new employees*1 | New graduates | 25 | 45 | 47 |
| Mid career employees | 9 | 10 | 13 | |
| Total | 34 | 55 | 60 | |
| Number of leavers (including voluntary resignation, retirement, death, and disciplinary actions) | Voluntary resignation | 60 | 68 | 88 |
| Total | 208 | 224 | 240 | |
| Turnover rate | 1.4% | 1.7% | 2.1% | |
| Retention rate for new graduates after 5 years*2 | 91.5% | 88.2% | 91.8% | |
| Average tenure of service (years) | 18.0 | 17.7 | 17.6 | |
-
*1Number of Employees Assigned to Suntory Beverage & Food Ltd at Entry
-
*2Calculated for New Graduates Hired as Regular Employees by Suntory Holdings Ltd and Suntory Beverage & Food Ltd from 2016 to 2018
Women Employed in Japan
(as of December 31, 2024)
(employees)
| 2022 | 2023 | 2024 | ||
|---|---|---|---|---|
| Number | Executives | 3 | 5 | 5 |
| Manager | 36 | 45 | 47 | |
| Ratio | Executives | 14.3% | 25.0% | 25.0% |
| Manager | 7.0% | 8.7% | 9.2% | |
Number of Employees with Disabilities and Employment Rate(as of June 30, 2024)
(employees)
| 2022 | 2023 | 2024 | |
|---|---|---|---|
| Employees with disabilities | 42 | 41 | 42 |
| Employees with disabilities employment rate | 2.65% | 2.76% | 2.88% |
-
*Full-time employees of Suntory Beverage & Food International
Work Style(as of December 31, 2024)
| 2022 | 2023 | 2024 | |
|---|---|---|---|
| Average number of paid leave days taken (days) | 17.6 | 17.6 | 16.7 |
| Average Monthly Overtime Hours (hours) | 18.7 | 19.2 | 19.9 |
-
*All employees are encouraged to take at least 16 days of paid leave annually
-
*Applicable to regular employees affiliated with Suntory Holdings Ltd /Suntory Beverage & Food Ltd who work in Suntory Holdings Ltd, Suntory Beverage & Food Ltd, Suntory Spirits Ltd, Suntory Products Ltd, Suntory Foods Ltd, Suntory Business Systems Ltd, Suntory Wellness Ltd, Suntory Global Innovation Center Ltd, and Suntory System Technology Ltd.
Balancing work and childcare/nursing care(as of December 31, 2024)
(employees)
| 2022 | 2023 | 2024 | Coverage | ||
|---|---|---|---|---|---|
| Number of employees taking Childcare leave | Male | 39 | 61 | 58 | SBF-affiliated employees*2 |
| Female | 36 | 30 | 38 | ||
| Total | 75 | 91 | 96 | ||
| Childcare leave acquisition rate*1 | Male | 66.1% | 113.0% | 109.4% | |
| Female | 109.1% | 107.1% | 97.4% | ||
| Number of Job Return registrants for the Year | 0 | 1 | 2 | SBF-affiliated Regular Employees*2 | |
| Number of Employees taking nursing care leave | 0 | 1 | 0 | ||
| Number of Employees using home helper services | 0 | 0 | 0 | ||
-
*1The acquisition rate for male childcare leave is calculated according to the method stipulated in Article 71-4, Item 1 of the Enforcement Regulations of the Act on the Welfare of Workers Taking Childcare Leave, Nursing Care Leave, etc., effective April 1, 2023.
-
*2Suntory Beverage & Food Ltd (SBF)
Learning & Development(as of December 31, 2024)
(employees)
| 2022 | 2023 | 2024 | Coverage | ||
|---|---|---|---|---|---|
| Annual Training and Education cost per employee (yen) | 301,000 | 368,000 | 392,000 | Regular employees affiliated with SHD/SBF*2 *3 | |
| Suntory Self-Development Program (Self learning) | Number of participants in application-based Training | 3,810 | 2,757 | 1,942 | |
| Number of participants taking E-learning program | 1,015 | 1,042 | 2,054 | ||
| Number of participants in TERAKOYA*1 | 27,465 | 29,524 | 25,504 | Group companies in Japan | |
| The number of participants in Global leadership Development Support Initiatives | Global Leadership Forum | 15 | 21 | 18 | Entire Suntory Group including oversea companies |
| Suntory Harvard Program | 31 | 20 | 0 | ||
| Beyond Borders | 26 | 26 | 26 | ||
| Global Leadership Development Program | 29 | 50 | 24 | ||
| Ambassador Program | 39 | - | 27 | Overseas Companies | |
| Number of Successful candidates for oversea trainee program | 23 | 26 | 19 | Regular employees affiliated with SHD/SBF*2 *3 | |
-
*1A casual learning platform where employees can interact voluntarily and broaden your knowledge.
-
*2Suntory Holdings Ltd (SHD)
-
*3Suntory Beverage & Food Ltd (SBF)
Income Taxes Paid
Income Taxes Paid of Suntory Beverage & Food
| Japan | Overseas | Total | |
|---|---|---|---|
| 2022 | 5.3 | 23.3 | 28.6 |
| 2023 | 11.6 | 24.9 | 36.5 |
-
*The above amounts are based on "Country-by-Country Report" submitted to Japanese Tax Authorities, and not directly related to the Consolidated Financial Statements.