


On the Rise of Happiness In Japan
by Neil Nevitte
Introduction
Commentators have expressed interest in levels of happiness in Japan for more than three decades (Nishiyama, 1976). Greater international attention was drawn to the Japanese case in part as a consequence of findings reported in Ronald Inglehart’s seminal Culture Shift(1990). Drawing on cross-national comparative survey evidence from the 1981 and 1990 rounds of the World Values and European Values Surveys (WVS / EVS), Inglehart arrived at the conclusion that Japan was something of an underachiever when it comes to the happiness levels of its citizens (1990, p. 33). Money does not make people happy but according to those and other findings (Helliwell & Wang , 2012), people in wealthier countries typically are happier than their counterparts in poorer ones. In characterizing Japan as “an underachiever”, Inglehart was simply making the point that the Japanese public was significantly less happy than publics in other similarly wealthy advanced industrial states. But does that original characterization still hold up?
Any empirical evaluation of that question entails navigating a variety of measurement controversies that swirl around recent global investigations of comparative levels of happiness and subjective wellbeing (Veenhoven & Hagerty, 2006; Easterlin R. A., 2003). One strategy, the approach adopted here, involves replicating as closely as possible the methodology employed in Inglehart’s original analysis. As before, the following exploration relies on data from the WVS / EVS databank. That data source now encompasses a much longer time span, from 1981 to 2006. Data from multiple and more extended time points provide a more reliable gauge for evaluating changes in these kinds of orientations. There are other important advantages that come from using these data. WVS / EVS are the largest, and longest running collaborative cross-national and cross-time surveys ever undertaken. Moreover, these surveys are deliberately coordinated in several important respects. First, they employ the same random national sample methodologies and they use the same data collection strategies. Secondly, and particularly relevant here, they use the same question wordings on key survey items. This means that if any variations in such basic outlooks as happiness are detected then it islikely that these variations are genuine ones rather than a result of differences in methodology. Finally, because the WVS / EVS have been continuously conducted in multiple countries, it is now possible to compare data from Japan with data from multiple other advanced industrial states across the same twenty four year time span.
The place to begin is with the broad picture. The first section tracks the aggregate trends in levels of happiness in Japan in comparison with those reported by publics in fourteen other advanced industrial states. The next partprobesthose aggregate findings in greater detail to determine what background factors, if any, are associated with outlooks towards happiness. The Japanese findings are placed in context using WVS / EVS data from other advanced industrial states.
Aggregate Findings
Respondents in Japan and the other advanced industrial states have all been asked the identical question about happiness during each round of the WVS / EVS surveys: taking all things together, would you say that you are: (1) very happy, (2) quite happy, (3) not very happy, or (4) not at all happy?
The aggregate responses to these questions over a twenty four year period are summarized in Figure 1. There are some striking findings.
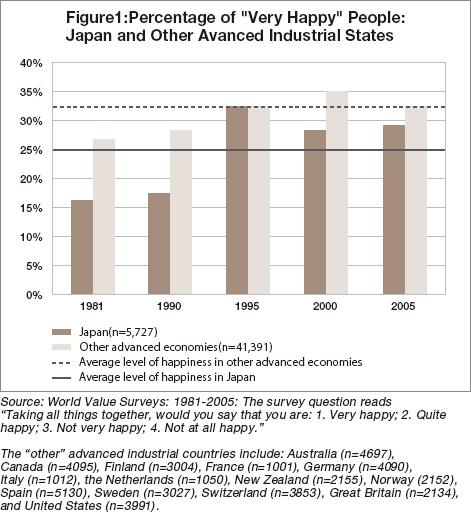
First, it comes as no surprise at all to find that the results for 1981 and 1990 do indeed replicate those reported inInglehart’s original analysis(1990); the Japanese public were comparative “underachievers” when it comes to levels of happiness. That general finding also holds when the long term averages for Japan’s happiness scores are compared with those from the publics in other wealthy advanced industrial states. The far more strikingfindings, however, concern the changes in Japanese levels of happiness after 1990. Notice that levels of happiness spiked in Japan in 1995. At that point about one in three Japanese respondents reported that they were “very happy”. Moreover, Japanese levels of happiness were almost identical to those reported by the other publics at that particular moment. It is possible, of course, that the 1995 results are outliers; they may reflect some temporary or unusual period effect. But even if those data are discounted as atypical, the broader cross-time trend is unmistakable. Japan’s levels of happiness thereafter continued to evolve along an upward trajectory and Japan’s happiness deficit, the difference between Japan’s happiness levels and those reported by publics in other wealthy economies, narrowed substantially. Notice also that Japan’s happiness deficit after 1995, was about half of what it was before 1995. Japan may once have been considered an underachiever, or a laggard, but the evidence covering a much longer time span seems to indicate that the levels of happiness in that country are catching up to those exhibited by publics in other wealthy advanced industrial states.
Unpacking the Evidence
These striking changes raise another question: what explains variations in levels of happiness? Economists, psychologists, sociologists and political scientists have proposed a number of different explanations for what might lie behind variations in levels of happiness. Some contend that such structural factors as the performance of the economy, the distribution of wealth, and unemployment rates are important (Ferrer-i-Carbonell, 2005; Easterlin R. A., 2003; Inglehart et al., 2008; Inglehart, 1997).Others suggest that such quality of life indicators as divorce rates, the state of public health and the quality of interpersonal relations and community life are likely to lie behind such variations (Frey, et al., 2008; Lee et al., 1991; Myers & Diener, 1995). Yet other analysts take a broad contextual perspective noting that aggregate levels of citizen happiness tend to be higher in older welfare states. The implication behind that line of reasoning is that what matters is a combination of generous social supports along with sustained experience with a consolidated democracy and responsive institutions (Inglehart, et al., 2008). There are also a legion of prospective explanations that focus on individual level characteristics such as employment status, gender, income and educational levels, marital status and the like (Di Tella et al., 2003; Easterlin, 2001; Easterlin, 2006; Ferrer-i-Carbonell, 2005; Frey et al., 2008; Graham & Pettinato, 2002; Hirata, 2011; Myers & Diener, 1995; Winkelmann & Winkelmann, 1998). These conjectures certainly seem plausible. It is not possible to systematically test each and all of these hypotheses here, but it is possible to dig into the data in more detail to probe how levels of happiness have changed across time and to do so both within and between these populations.
The evidence presented in Table 1 presents a great deal of data; it summarizes levels of happiness across different dimensions and for different time points. These findings are revealing in a number of respects.


Consider, first, the case of employment status. It is plausible to suppose that people who enjoy the security of a full time job might be happier than those who do not. And indeed, when all the data are considered together, there is modest empirical support for that proposition . Even so there are significant segments of most publics, retired people and families with young children, of course, who readily volunteer not to be in the full time paid workforce. From that vantage point, it is less surprising to find that, for other industrial economies, there is equivalence and stability in aggregate levels of happiness of full time employees and others between 1981 and 2001. The data for Japan, though, are quite different: those outside of the full time workforce are significantly happier than those employed full time. But also note that the aggregate levels of happiness among both groups increased across time.
What about marital status? The conventional wisdom is that married people are somewhat happier than those who are single (Di Tella, et al., 2003; Frey, et al., 2008). That general finding is confirmed both for Japan and for publics in other advanced industrial states across the entire period for which we have WVS / EVS data. The difference in the proportion of “very happy” married Japanese citizens and those in other advanced states were quite large in 1981 (17 % versus 31 %). But those cross-national discrepancies narrowed over the twenty four year period. Married people in Japan in 2005 were almost twice as likely (32 %) as their 1981 counterparts (17 %) to report that they were “very happy”.
When it comes to gender differences, women are typically somewhat happier than men. But as in other instances, there are both cross-time and cross-national variations and these seem to conform to a pattern. In 1981, for example, Japanese women were significantly less likely to report that they were “very happy” (18 %) than their counterparts in other advanced industrial states (39 %). But by 2005, those cross-national variations virtually disappeared. And the trajectories for Japanese men were quite similar.
As others have observed, levels of satisfaction across different domains tend to interact and be cumulative(Frey, et al., 2008; Hirata, 2011). But the relationship between objective conditions and subjective evaluations is not always straightforward. The case of income illustrates the point. To be sure, it is generally the case that wealthier people report that they are happier than their poorer co-nationals. But the differences in levels of happiness between the wealthier and poorer are not as great as one might expect; they are of the order of only 10 to 15 points. Indeed, somewhere between one and four and one in five of those in the lowest income groups report that they are “very happy”. Wealthy Japanese respondents are somewhat less likely than their counterparts elsewhere to report that they are “very happy” but levels of happiness of that group increased significantly after 1981.
One of the most consistent findings to emerge from comparative analyses of happiness concerns the impact of health: research repeatedly demonstrates that healthier people are consistently more likely to report that they are happier than their less healthy counterparts (Frey, et al., 2008). The WVS / EVS data clearly support that conclusion. Healthy respondents are about twice as likely as unhealthy ones to report that they are “very happy”. Once again there is evidence of a consistent pattern. In 1981 about 20 percent of Japanese respondents who rated themselves as being “in good health” reported that they were very happy. By 2005 the levels of happiness in that same group had doubled. The levels of happiness reported by healthy citizens in other advanced industrial states, however, varied hardly at all. When it comes to comparable levels of happiness, it is clear that Japanese respondents lagged behind their counterparts in 1981. But those differences virtually disappeared by 2005.
Age is an important background variable to consider not least of all because it captures the compositional structure of the population. And a number of relevant factors clearly do interact with age. In comparative terms, the Japanese population is a relatively old one. And older people, typically, are less healthy than their younger counterparts. What is striking about the age related findings summarized in Table 1 are the similarities between the findings for Japan and the other advanced industrial states.
As in other advanced industrial states, younger Japanese respondents were more likely than their older co-nationals to report that they were happy. At least, that was the case in 1990. But by 2005, these age related differences disappeared; the happiness levels reported by younger and other respondents both in Japan and elsewhere progressively increased and converged.
Very similar trajectories emerge when it comes to the other variables under consideration. The religious, the trusting, and those believing that they have freedom of choice and control over their lives consistently report that they are happier than their secular, distrusting, and those feeling that they have less freedom and control. But the levels of happiness across all of these groups progressively increased between 1981 and 2005.
Concluding Discussion
What broad conclusions can be drawn from these findings? There are three main ones. First, the aggregate cross-national cross-time results point to robust increases in the levels of happiness among the Japanese public since 1981. The gap between Japan and the other publics prior to 1995 was wide and consistent. After that time point the levels of happiness increased consistently with the result that the once wide discrepancies between Japan and other advanced industrial states narrowed considerably. Even if the spike in the 1995 results is discounted, the reported measures of happiness levels in Japan after 1995 rose to a plateau that was significantly higher than the levels prior to 1995. The post 1995 shift, then, appears to be genuine.
Second, the evidence concerning the relationship between a variety of background variables that other analysts think are plausibly related to variations in levels of happiness are intriguing in other respects. It is clear from the results of more detailed analysis that some variables, net other factors, are better predictors of levels of happiness than others. Health status, for example, is a strong predictor of happiness in Japan as it is in the publics of all other advanced industrial states. Education is a stronger predictor of happiness in Japan than elsewhere as is marital status (married) and gender (women). That said these latter factors are significantly less important to happiness than perceptions about health. These findings suggest that such structural changes as growing access to post-secondary education and the improving status of women in society do matter. More striking than these variations, however, is the extent to which the rising trajectories of happiness are evident across all of these disparate background factors across multiple time points. The rising tide of happiness seems to lift all boats to a similar extent. The pattern of results also suggests that there are larger aggregate national forces at play.
There are at least two kinds of explanations that might account for the rising levels of happiness in Japan. As economists have emphatically shown such national traumas as an economic depression tend to have the same impact on all those who have first-hand experience of the trauma. And the effects of those traumas, be they economic or political disasters, dissipate with the passage of time and with population replacement. The same applies tothose who progressively enjoy the fruits of democratic consolidation. Compared to other advanced industrial states, Japan’s experiences with sustained democracy have been somewhat shorter, but the effects of that shortfall become less significant with the passage of time.
A second line of speculation to consider concerns expectations and aspirations. Psychologists and others (Campbell, et al., 1976) have argued that life satisfaction is governed by the gap between people’s life satisfaction and their expectations or aspirations. Thus sudden and unexpected unemployment might be expected to prompt a spike in personal levels of dissatisfaction or unhappiness. Obversely, the gradual improvements in the status of women across the last three decades might go some distance towards explaining why women in Japan, as in other countries, consistently report higher levels of happiness than men (Inglehart, 1990). Whether aspirations are subject to ceiling effects is a matter of dispute. But it is also plausible that the gap between objective conditions and expectations also gears variations in national levels of happiness.
References
Campbell, A., Converse, P. E., & Rodgers, W. L. (1976). The Quality of American Life: Perceptions Evaluations, and Satisfactions. New York: Russell Sage Foundation.
Di Tella, R., MacCulloch, R., & Oswald, A. (2003). The Macroeconomics of Happiness. Review of Economics and Statistics, 85(4), 809-827.
Easterlin, R. A. (2001). Income and Happiness: Towards a Unified Theory. The Economic Journal, 111(473), 465-484.
Easterlin, R. A. (2003). Explaining Happiness. Proceedings of the National Academy of Science of the United States of America, 100(19), 11176-11183.
Easterlin, R. A. (2006). Life cycle happiness and its sources- Intersections of Psychology, Economics, and Demography. Journal of Economic Psychology, 27(4), 463-482.
Ferrer-i-Carbonell, A. (2005). Income and well-being: an empirical analysis of the comparison income effect. Journal of Public Economics, 89(5-6), 997-1019.
Frey, B. S., Stutzer, A., Benz, M., Meier, S., Luechinger, S., & Benesch, C. (2008). Happiness: A Revolution in Economics. Cambridge: MIT Press.
Graham, C., & Pettinato, S. (2002). Happiness and Hardship: Opportunities and Insecurity in New Market Economies. Washington D. C.: Brookings Institution Press.
Helliwell, J. F., & Wang , S. (2012). The State of World Happiness. In J. F. Helliwell, R. Layard, & J. Sachs, World Happiness Report (pp. 10-57). New York: The Earth Institute, Columbia University.
Hirata, J. (2011). Happiness, Ethics and Economics (Vol. 142 of Routledge frontiers of political economy). New York: Taylor & Francis.
Inglehart, R. (1990). Cultural Shift in Advanced Industrial Society. New Jersey: Princeton University Press.
Inglehart, R. (1997). Modernization and Postmodernization: Cultural, Economic, and Political Changes in 43 Societies. Princeton: Princeton University Press.
Inglehart, R., Foa, R., Peterson, C., & Wetzel, C. (2008). Development, Freedom, and Rising Happiness: A Global Perspective (1981-2007). Perspectives on Psychological Science, 3(4), 264-285.
Iwao, S. (1976). A Full Life for Modern Japanese Women. In S. Nishiyama, Changing Values in Modern Japan (pp. 95-111). Tokyo: Nihonjin Kenkyukai.
Lee, G., Seccombe, K., & Shehan, C. (1991). Marital Status and Personal Happiness: An Analysis of Trend Data. Journal of Marriage and the Family, 53(4), 839-844.
Myers, D. G., & Diener, E. (1995). Who is Happy? Psychological Science, 6(1), 10-19.
Nishiyama, S. (Ed.). (1976). Changing Values in Modern Japan. Tokyo: Nihonjin Kenkyukai.
Veenhoven, R., & Hagerty, M. (2006). Rising Happiness in Naitons 1946-2004: A Reply to Easterlin. Social Indicators Research, 79(3), 421-436.
Winkelmann, L., & Winkelmann, R. (1998). Why Are the Unemployed so Unhappy? Evidence from Panel Data. Economica, 65(257), 1-15.
Methodological Appendix: Data Coding Protocols
Employment status: respondents were asked: “Are you employed now or not?” All responses other than "full time", including: part time, self-employed, retired, housewife, students, unemployed and other, are coded as "other".
Marital status: “married” or “living together as married” are coded as “married”. “Divorced”, “separated” or “widowed”, “single/never married” and “living apart but steady relation” are coded as “single”.
Income: “high income”are those reporting that they are either the “ninth step” or the “tenth step” of the scale of incomes.Those in the“lower step” or the “second step” are coded as “low income”.
Age: respondents between the ages of 15 and 29 are coded as “young”. Those over 50 years of age are classified as “old”.
Health status: respondents answering“very good” or “good” to the question: “all in all, how would you describe your state of health these days? Would you say it is…?” are coded as “good health”. Those reporting “poor” or “very poor”are coded as being in “poor health”.
Freedom of choice and control: respondents were asked: "Some people feel they have completely free choice and control over their lives, while other people feel that what they do has no real effect on what happens to them. Please use this scale where 1 means “none at all” and 10 means “a great deal” to indicate how much freedom of choice and control you feel you have over the way your life turns out." Those reporting “1”“2”“3” or “4”are coded as low sense of freedom of choice and control. Those reporting “10” are coded as “high” on this dimension.
Religiosity: respondents were asked: “Independently of whether you go to church or not, would you say you are?”Religiosity is coded “high” for those responding “a religious person” and “low” for those responding “not a religious person”.
Trust: respondentswere asked: “Generally speaking, would you say that most people can be trusted or that you need to be very careful in dealing with people?" Respondents saying “Most people can be trusted” are coded as “high” on trust. Those responding “you can't be too careful” arecoded as “low” on trust.
Asteion is a magazine published in Japanese twice a year.
It may be purchased from the publisher’s page.
![]()
![]()
|
|---|
- Vol.101 The COVID-19 Pandemic Through the Lens of Economics
- Vol.100 An Arena for Intellectual Opinion and Debate:Commemorating One-Hundred Issues
- Vol.099 Artists Crossing Borders
- Vol.098 A Historical Perspective on the “Chinese Dream”? : The Extent of the Sinosphere in East Asia
- Vol.097 The Ukraine War: A Global Perspective
- Vol.096 Common Sense in Economics, Common Sense in Popular Thought
- Vol.095 Academic Journalism
- Vol.094 Once Again, What Are Today’s Problems?
- Vol.093 A New American Century?
- Vol.092 The “Patchwork” Order Encompassing the World
- Vol.091 The Future as Possibility – Japan in 100 Years
- Vol.090 Redefining the State: 130 Years Since the Meiji Constitution
- Vol.089 The Paradox of Choice of Citizenship
- Vol.088 Special Feature: The End of the Liberal International Order?